
3 posts tagged with "shapes"

View All Tags

Using adaptive colours to diagram in light and dark modes

· 5 min read
draw.io
draw.io Team

When you change from light to dark mode in draw.io, the colours automatically switch intensity so that your diagram and its labels are easy to read. You can set now specific colours for shapes, connectors, text and the diagram page background for both light and dark modes via the updated colour palette.
An additional custom colour scheme has been added to the style palette in draw.io

Adaptive colours are important when part of your team prefers to work in dark mode, and the rest prefers light mode.

Colour style - use a specific dark and light colour

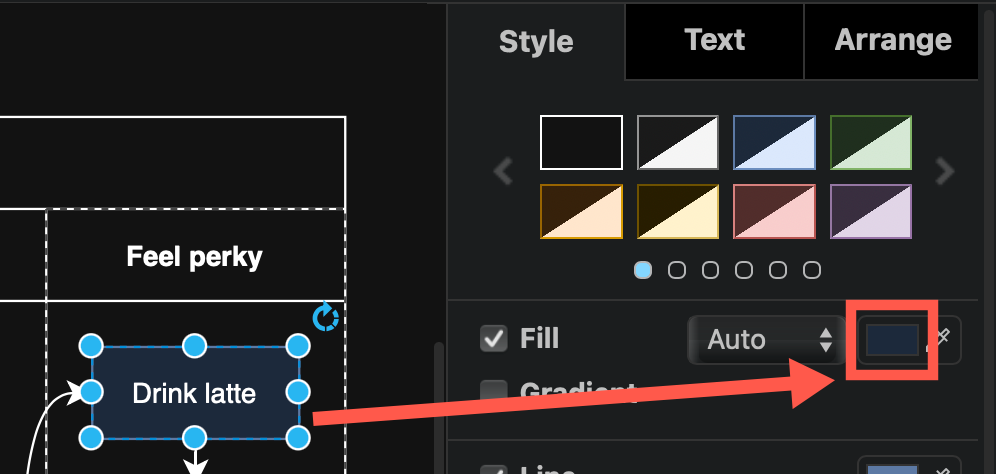
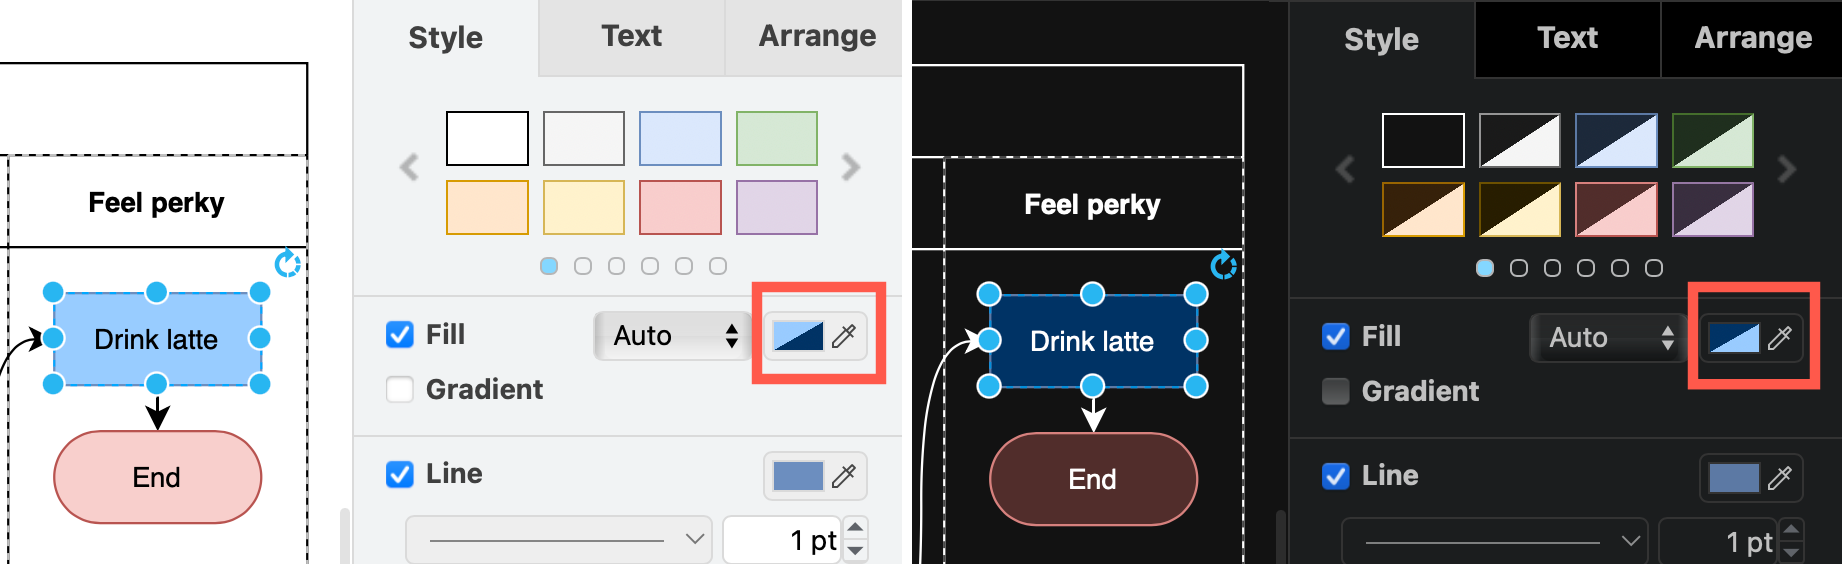
  1. Select one or more shapes, connectors, text labels, or the diagram background, then click on a colour block to open the colour palette, for example, the Fill colour of a shape.
    Select one or more shapes and open the colour palette
  2. Click Advanced to see the dark mode colour settings in the palette.
    Select one or more shapes and open the colour palette
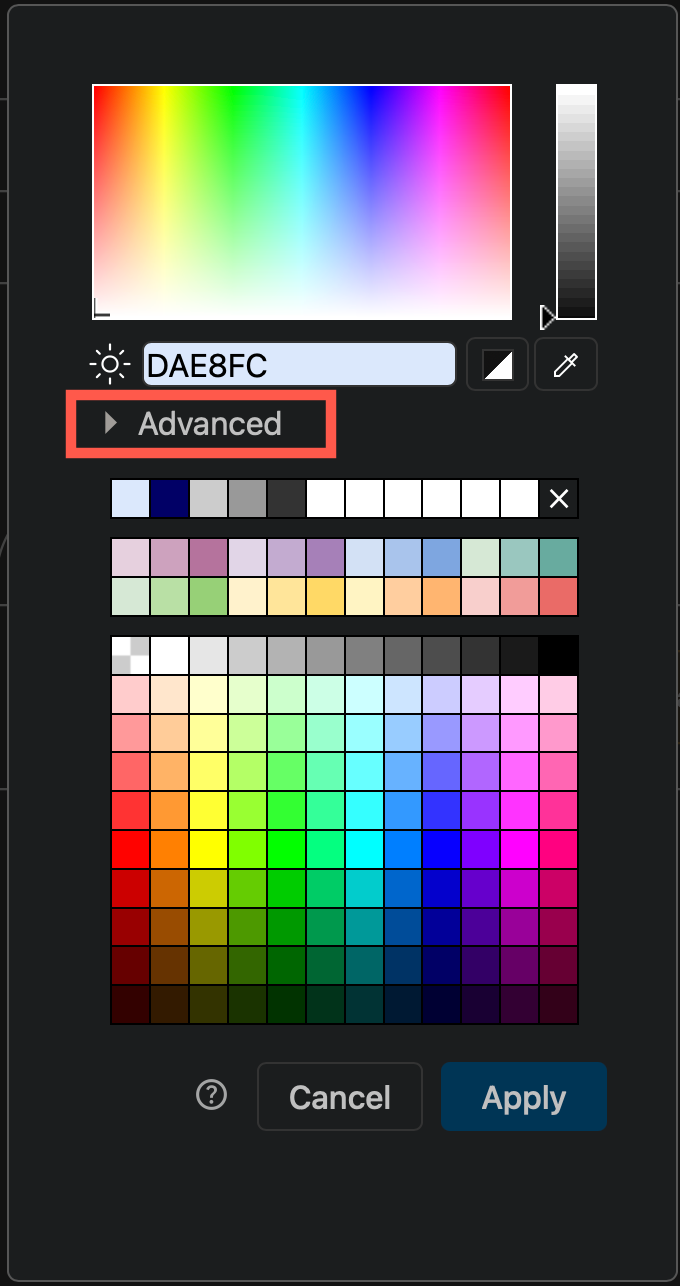
  3. Enter a colour value in the Light mode field (sun). The dark mode value will update automatically to its inverse if you are using the Automatic adaptive colour setting.
  4. To use a specific dark mode colour instead, enter a different colour value in the Dark mode field (moon). This colour is now User-defined.
    Select one or more shapes and open the colour palette
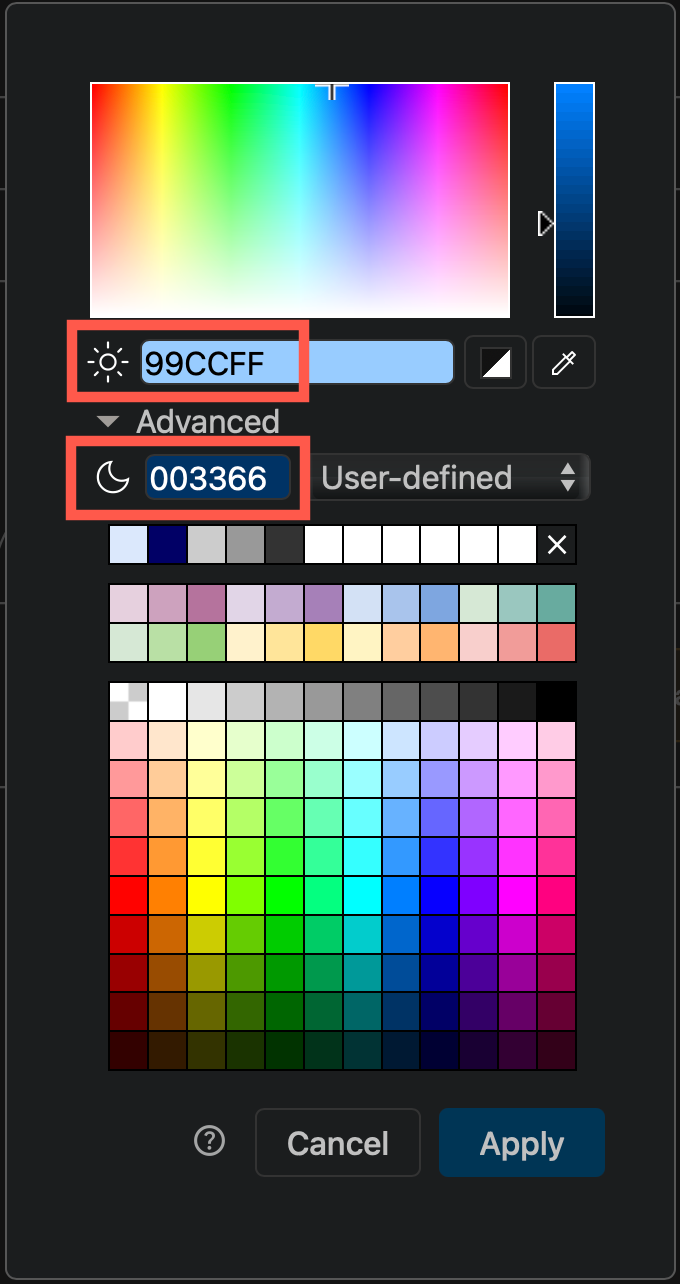
  5. Click Apply to save the colour style to your selected shapes, connectors, text or diagram page background.

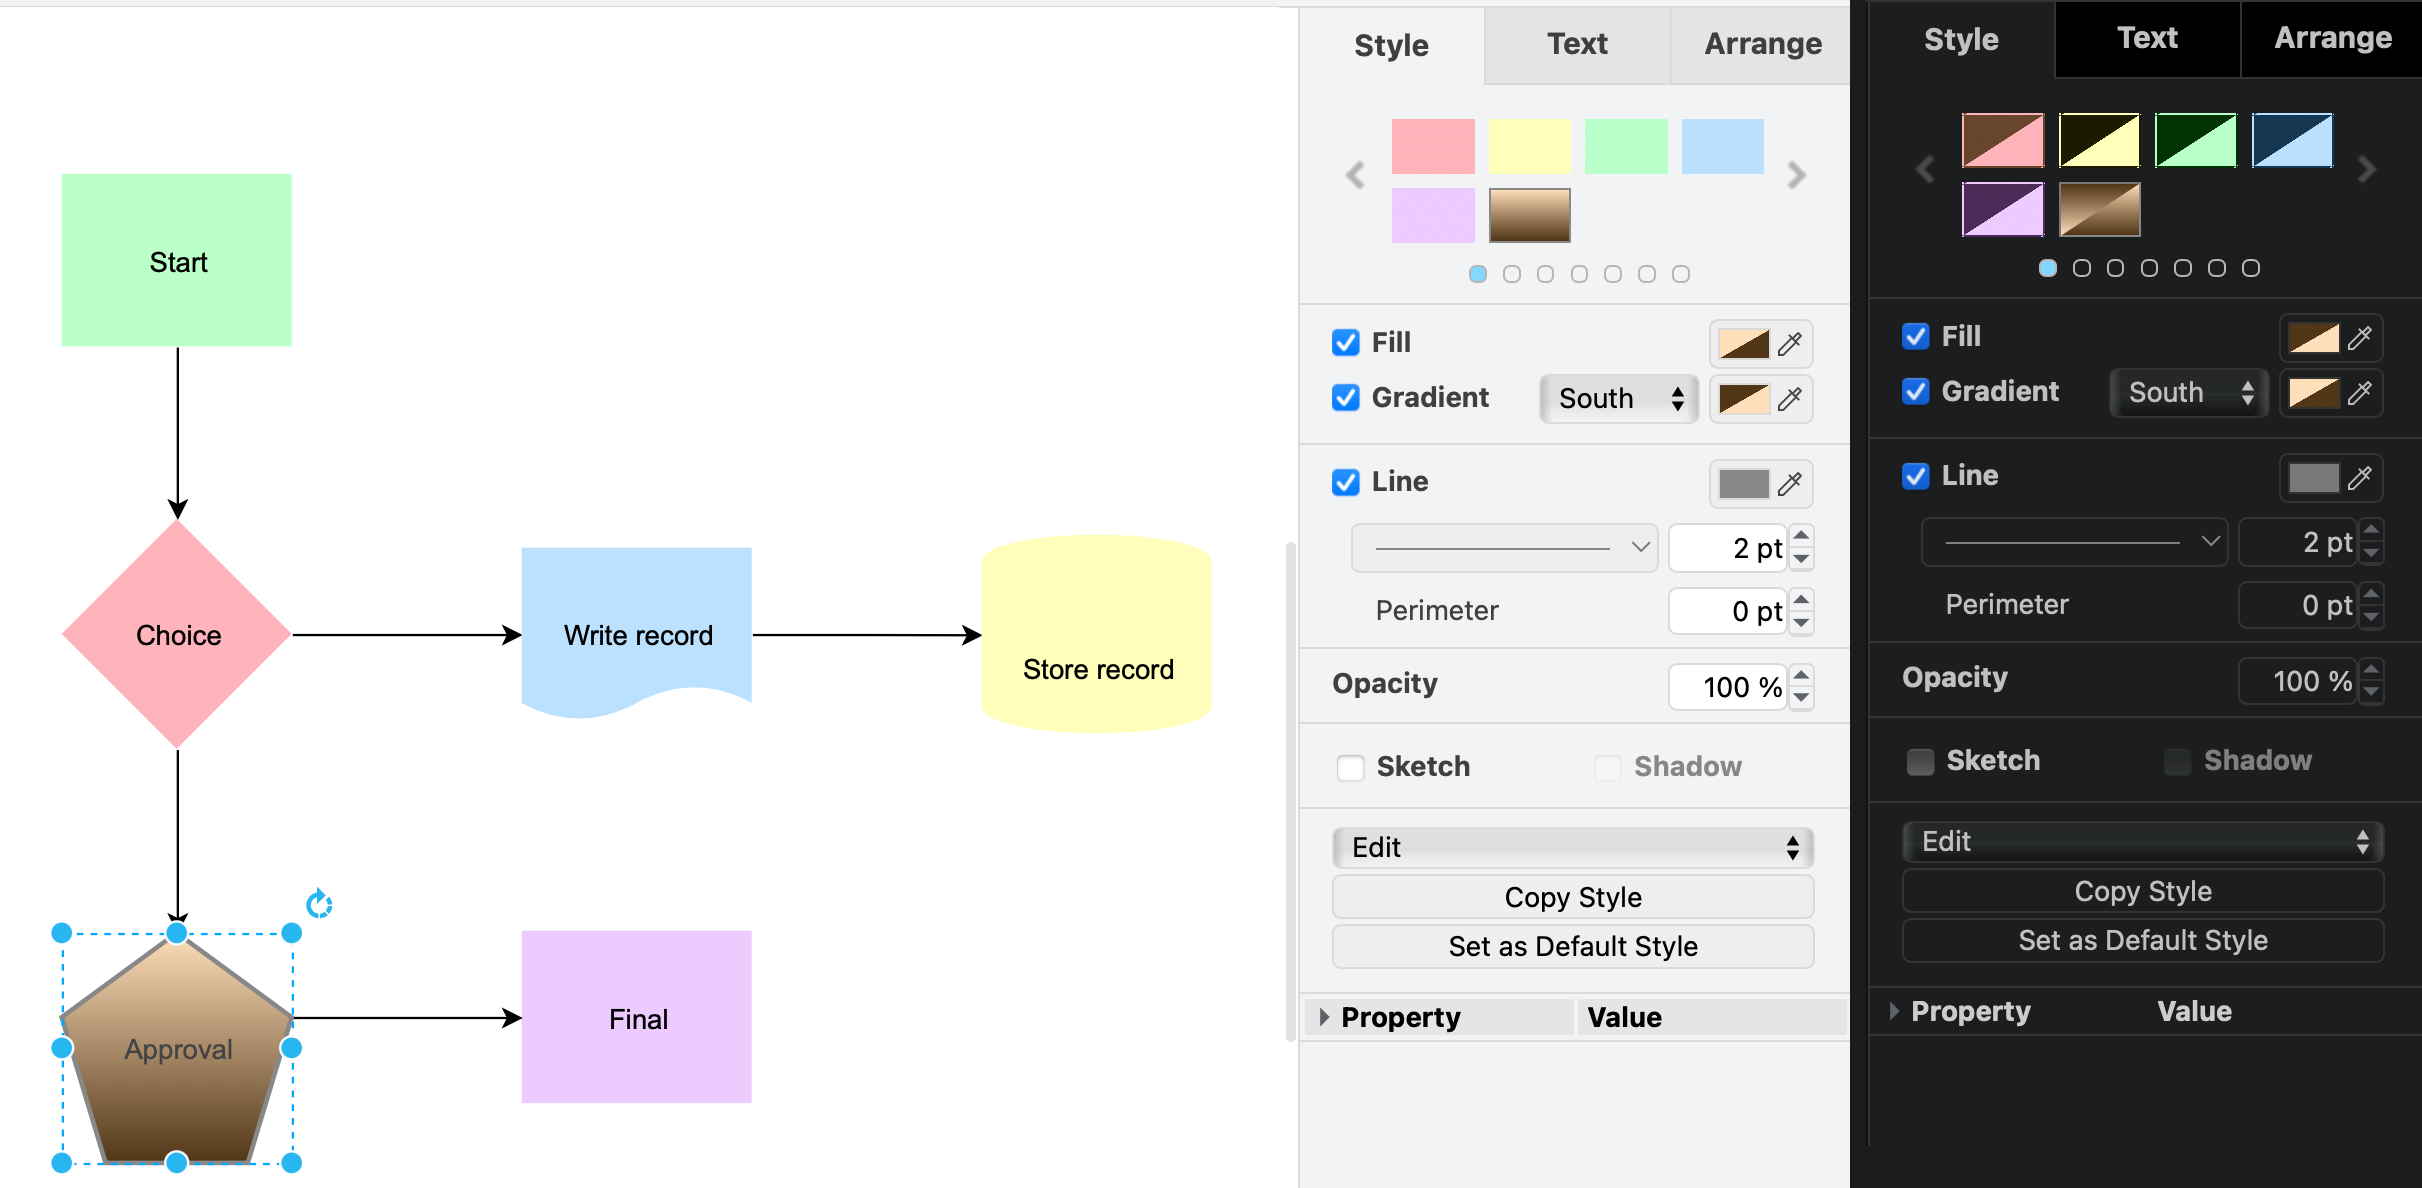
You'll notice that the colour block now has two triangles, in both dark and light mode.
Change the adaptive colours settings on a diagram in draw.io via the Extras menu or the Style tab in the format panel when nothing is selected

Tip: To use the same colour in dark and light modes, enter the same value in both fields.

Adaptive colour settings

Each page in a multi-page diagram has its own adaptive colour setting.

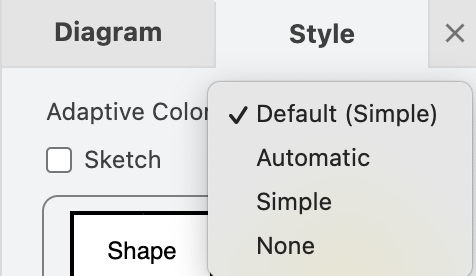
With nothing selected in your diagram page, click on the diagram Style tab. Change the Adaptive Colors setting. Alternatively, select Extras > Adaptive Colors from the menu.
Change the adaptive colours settings on a diagram in draw.io via the Extras menu or the Style tab in the format panel when nothing is selected

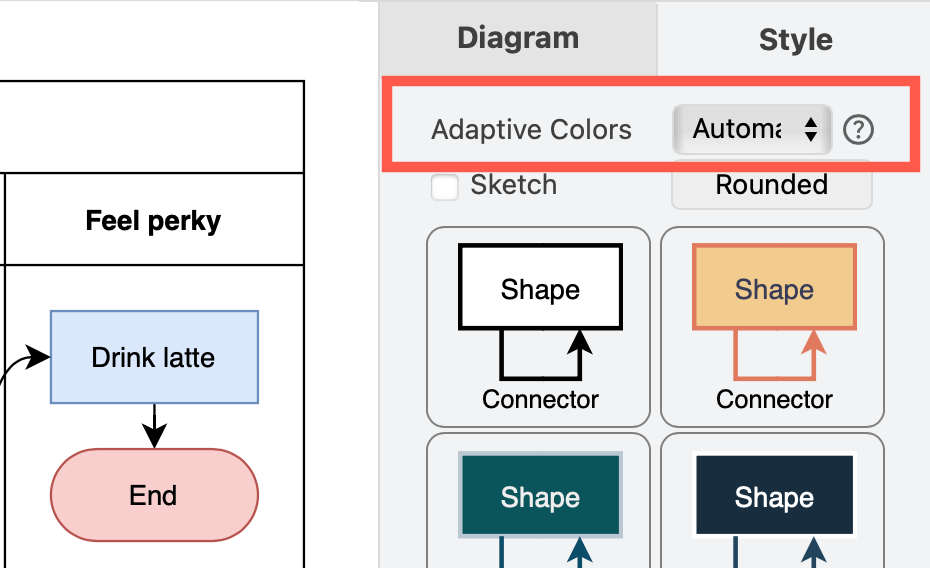
  • Automatic: Changes the intensity to enhance the contrast of all coloured elements in a diagram. This is set by default.
  • Simple: Improves the contrast of only the black and white elements, and retains all other colours. Thus the same palette can be used in dark and light modes.
  • None: Disables adaptive colours in dark mode completely. Diagrams will appear as they would in light mode even if you enable dark mode in the draw.io editor.
Change the adaptive colours settings on a diagram in draw.io via the Extras menu or the Style tab in the format panel when nothing is selected

Set defaultAdaptiveColors in the draw.io configuration to simple or none when you want your diagram colours to stay the same in light and dark modes.
Select one or more shapes and open the colour palette

Step by step: Configure default adaptive colours

Sharing diagrams with adaptive colours

The adaptive colour settings are saved in the diagram file. When you share your diagram file, a URL link with the diagram or HTML code with the diagram embedded, when it is reopened in the editor, the diagram will display with the adaptive colour settings it was saved with.

Diagrams pose a particular challenge when automatically adjusting colours for readability in dark mode.

If you want to reset a diagram to automatically adapt to dark mode, you can remove all the user-defined dark-mode colours.

See how to set custom dark-mode colours in the style and colour palettes with the light-dark function for each color definition.

Learn more about how adaptive colours work when you export to an SVG image.

Draw Azure architecture diagrams with updated shapes

· 7 min read
draw.io
draw.io Team

The Azure shape library in draw.io has been updated. You can draw Azure architecture diagrams for your cloud infrastructure from scratch, or import .vsdx files or exported diagrams from automated infrastructure documentation apps like Cloudockit.
Azure architecture diagrams are easy to draw with the hundreds of Azure shapes in draw.io

Open this Azure architecture example in the online draw.io editor

Draw Azure diagrams in logical blocks

You will likely never draw a single Azure diagram that contains all levels of detail. You can either start with the overview diagram and work from this top level down to the details, or bottom up starting with the logical blocks in your architecture.

  • Azure architecture overview diagram: Includes design principles and the broad choices of specific services in your subscriptions.

  • High-level Azure diagrams: Includes Azure services and their configuration, resource groups, virtual networks, and environments. Performance, regional service provision, availability zones, monitoring, backup and recovery services are included at this level of detail.

  • Low-level diagrams: These are less common, and usually document the specific details needed to implement the design and the continuous integration/continuous deployment pipelines.

Enable the Azure shape library

  1. Go to our online editor or open one of the draw.io integrations or our desktop app.
  2. Click on More Shapes at the bottom of the left panel.
  3. In the Networking section, click on the checkbox to enable the Azure shape library, and click Apply.
    Select the Azure shape library in the Networking section to use these shapes

The Azure shape library will load in the left panel, with its shapes separated into categories.
The Azure shape library is well organised into categories

Tip: You can also search for Azure using the Search Shapes text box to see a list of all Azure shapes not sorted in categories.
Search for 'azure' to see all the shapes without them being sorted into categories

Use the scratchpad

Many Azure architectures repeat sub-sections of the architecture for backup or redundancy purposes. Instead of placing copies, you can put that sub-section into the scratchpad.

  1. Select all the shapes on the drawing canvas that you want to repeat.
  2. Drag these onto the scratchpad in the left panel.

Click on the sub-section shape in the scratchpad to add it to the drawing canvas, or drag another copy from the scratchpad into position.
Use the scratchpad to quickly copy common subsections of your Azure architecture diagram

See how to use the scratchpad in draw.io

Use rectangles to indicate regions

Use rectangles from the General shape library to indicate a region. Once you've placed and resized a region shape, send it to the back on the Arrange tab of the format panel so that it is placed behind the Azure architecture's shapes.
Move region shapes to the back via the Arrange tab of the format panel, behind the other shapes in your Azure diagram

Next, update the rectangle style to separate regions in the Style tab of the format panel on the right.

  • Dashed outline - Change the Line of the region to Dashed using the dropdown list, and ensure the Fill checkbox is not selected to remove the background.
    Change the Style of basic rectangles in the format panel to indicate different regions in your Azure architecture

  • Coloured background - Click on the colour block to the right of the Fill checkbox and select a new colour from the palette. Ensure the Line checkbox is not selected or set the colour to match the fill colour.
    Change the Style of basic rectangles in the format panel to indicate different regions in your Azure architecture

Tip: Group all of the shapes contained within the region with the region rectangle so you can more easily move them together.

Draw connectors

Hover over any shape in the diagram to drag a connector from one of the four connection arrows, then drop it on another shape (or group of shapes) to connect the two.

Floating connectors: Floating connectors move around the perimeter of the shape intelligently as you reposition it on the drawing canvas. Drop the connector on the target shape when the outline is blue.
Use floating connectors to make it easier to move the Azure shapes around on the drawing canvas

Fixed connectors: Fixed connectors remain connected to a particular point on the target shape when you reposition it. Drop the connector on a connection point (a little cross) or when the outline of the shape is green.
Use fixed connectors to ensure a connector stays attached to that particular point when move the Azure shape around on the drawing canvas

Learn more about working with connectors in draw.io

Azure architecture templates

Several Azure diagram templates are available in the template library.

  1. Click Arrange > Insert > Template to open the template library.
  2. Expand the Cloud section and select Azure to see the Azure diagram templates.
    Start with a template for your Azure architecture diagram in draw.io
  3. Click on a magnifying glass in the top right of any template to see a preview.
  4. Select a template and click Insert to add it to the drawing canvas.
    Start with a template for your Azure architecture diagram in draw.io

Export and embed your Azure diagram

Select File > Export as from the menu.

Tip: Make sure you select the Include a copy of my diagram in the Image export options dialog to allow those you share it with to edit it.

Embed diagrams in the following documentation platforms

Updated shapes for GCP and AWS network diagrams

· 4 min read
draw.io
draw.io Team

You can create network diagrams from scratch in draw.io using shapes that match the platform you are using - AWS, GCP, Veeam, Azure, Cisco, IBM and many more. Both the draw.io AWS19 and GCP Icon shape libraries for network and cloud architectures have been updated recently.

Open the updated network shape libraries

Both the Amazon Web Service and Google Cloud Platform shape libraries have been updated recently. Enable the shape libraries that you need to use in draw.io.

  1. Click on More Shapes in the left-hand panel.
  2. In the Networking section, click on the checkboxes next to the libraries you want to enable, then click Apply.
    Enable the AWS19 shape library for Amazon Web Services infrastructure diagrams in draw.io

If you want to see the shape names even when you aren't hovering over a shape in the shape libraries, click on the Labels checkbox in the shape library selection dialog.

Hover over any shape in the shape libraries on the left of the drawing canvas to see a preview and its name.
Hover over any shape to see a preview and its name in draw.io

Drag the shape library panel edge towards the drawing canvas to expand the panel and see more shapes.
Drag the edge of the shapes panel to make it larger

Updated AWS19 network shapes

Enabling the AWS19 shape library will give you a large number of sub-libraries in the left panel, sorted into logical categories. Expand the categories that you need by clicking on the sub-library's title or the arrow next to it.

As you can see below, the AWS19 shape library for modelling cloud service architectures on Amazon's platform is large and varied.
The AWS19 shape library for Amazon Web Services infrastructure diagrams has been updated in draw.io

Create a new diagram with the AWS19 shape library already enabled

Updated GCP Icons

The large Google Cloud Platform shape library containers older labels and icons, whereas the updated GCP Icons are sorted into their own shape library. Click More Shapes and enable the GCP Icons library to see updated sub-libraries shown below.
The GCP icons shape library for Google Cloud Platform infrastructure diagrams has been updated in draw.io

Create a new diagram with the GCP Icons shape library already enabled

Some cloud visualisation platforms can output diagrams in the .drawio format, including Cloudcraft and Cloudockit.

Embed the exported diagram in your system documentation or display it in your wiki with one of our draw.io integrations.

Network diagram templates

draw.io includes many templates for common cloud infrastructures on several platforms. Select Arrange > Insert > Template from the menu.
Network diagrams in the templates at draw.io