
25 posts tagged with "features"

View All Tags

Useful medical diagrams for patients

· 7 min read
draw.io
draw.io Team

Diagrams for the medical industry are often described from the perspective of an organisation or hospital, but how can the most important people in medicine - the patients - use diagrams themselves to get better treatment outcomes?
Add your name, date of birth, and the date you updated each diagram on the three labels of a plain connector

Doctors are under pressure to see as many patients as possible. Plus, it can be quite intimidating for patients during a consultation, and often impossible to describe all relevant symptoms in a way that is concise and clear.

Diagrams that present all the relevant information make life easier for both the patient and doctor.

Humans take in information faster and misunderstand less often when it is presented visually. Plus, if you diagram your medical problems, you can re-use the diagrams with other doctors - it saves you the stress of remembering all the details and explaining them in exactly the same way multiple times.

So, what type of diagrams can patients use?

Concept maps to relate symptoms

A directed graph or concept map can show at a glance which clusters of symptoms are related, and which are secondary. Such a diagram helps doctors evaluate which illnesses could be the underlying problem and find solutions for multiple symptoms.
A symptom graph noting common long covid symptoms - see it in a glance rather than a long spoken explanation

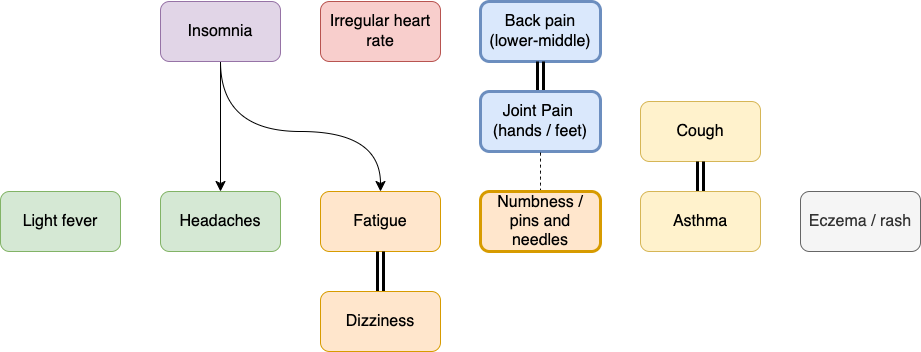
  • Use light fill colours to group related clusters of symptoms, and black text for ease of scanning and printing.
  • Use thicker connectors or shape outlines to show a stronger impact (Line in the Style tab of the format panel).
  • Use arrows or a double connector for symptoms that are triggered by other symptoms.

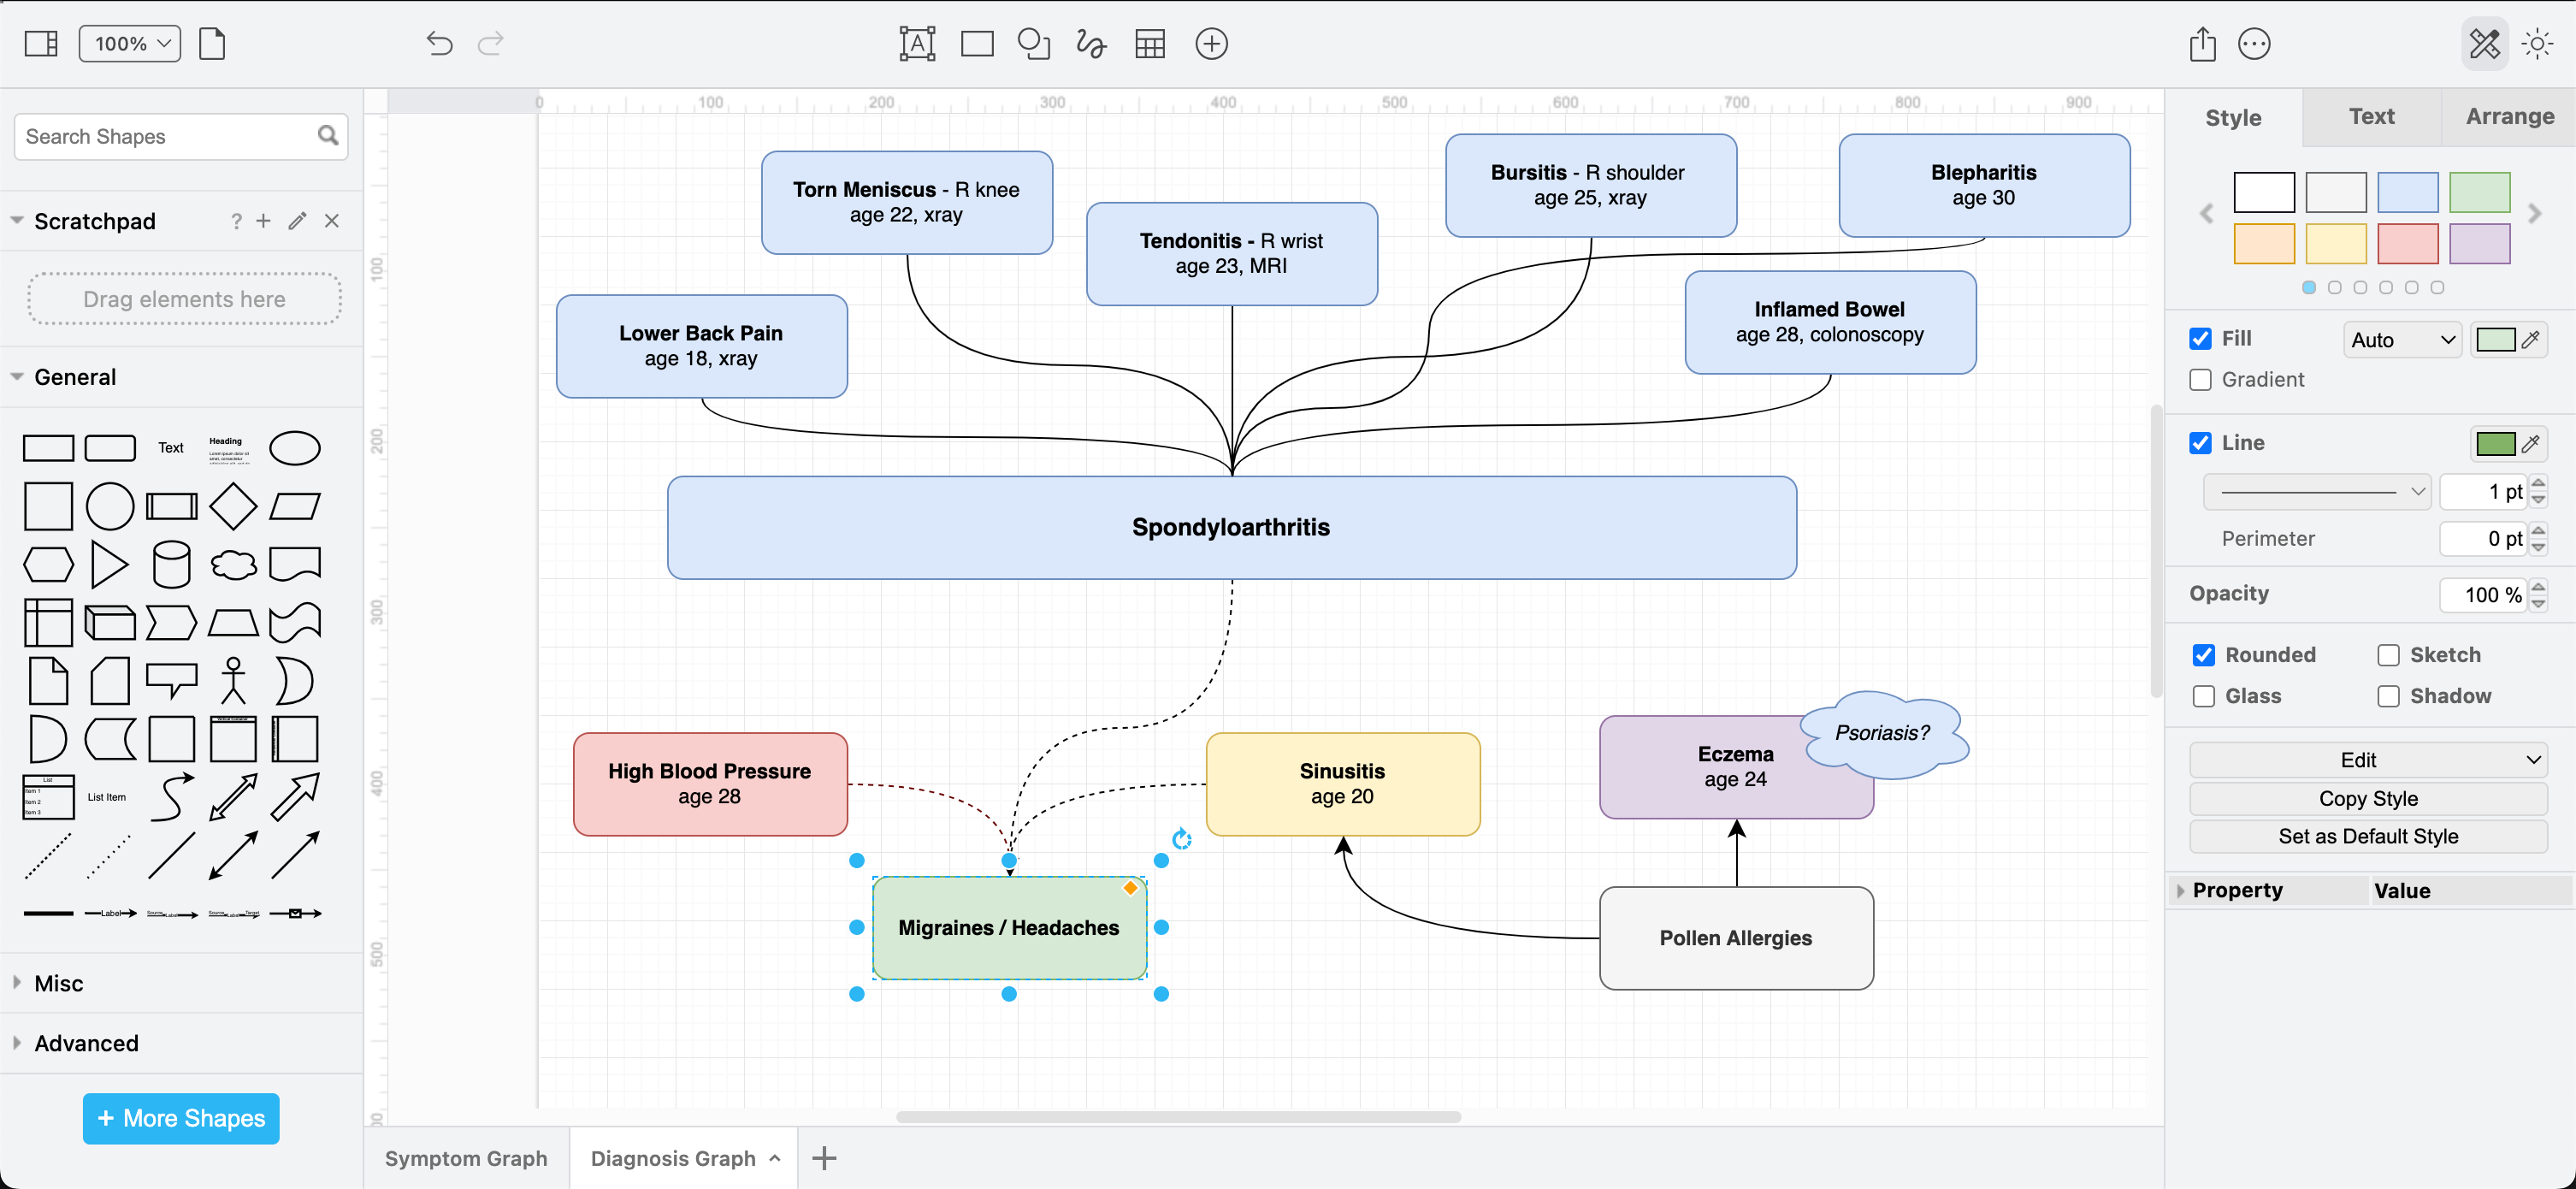
Concept maps to detail diagnoses

Doctors may find it more helpful to see how diagnoses are related if you are unlucky enough to have been diagnosed with several illnesses, especially where treatments can interfere with other diagnoses.
A symptom graph noting common long covid symptoms - see it in a glance rather than a long spoken explanation

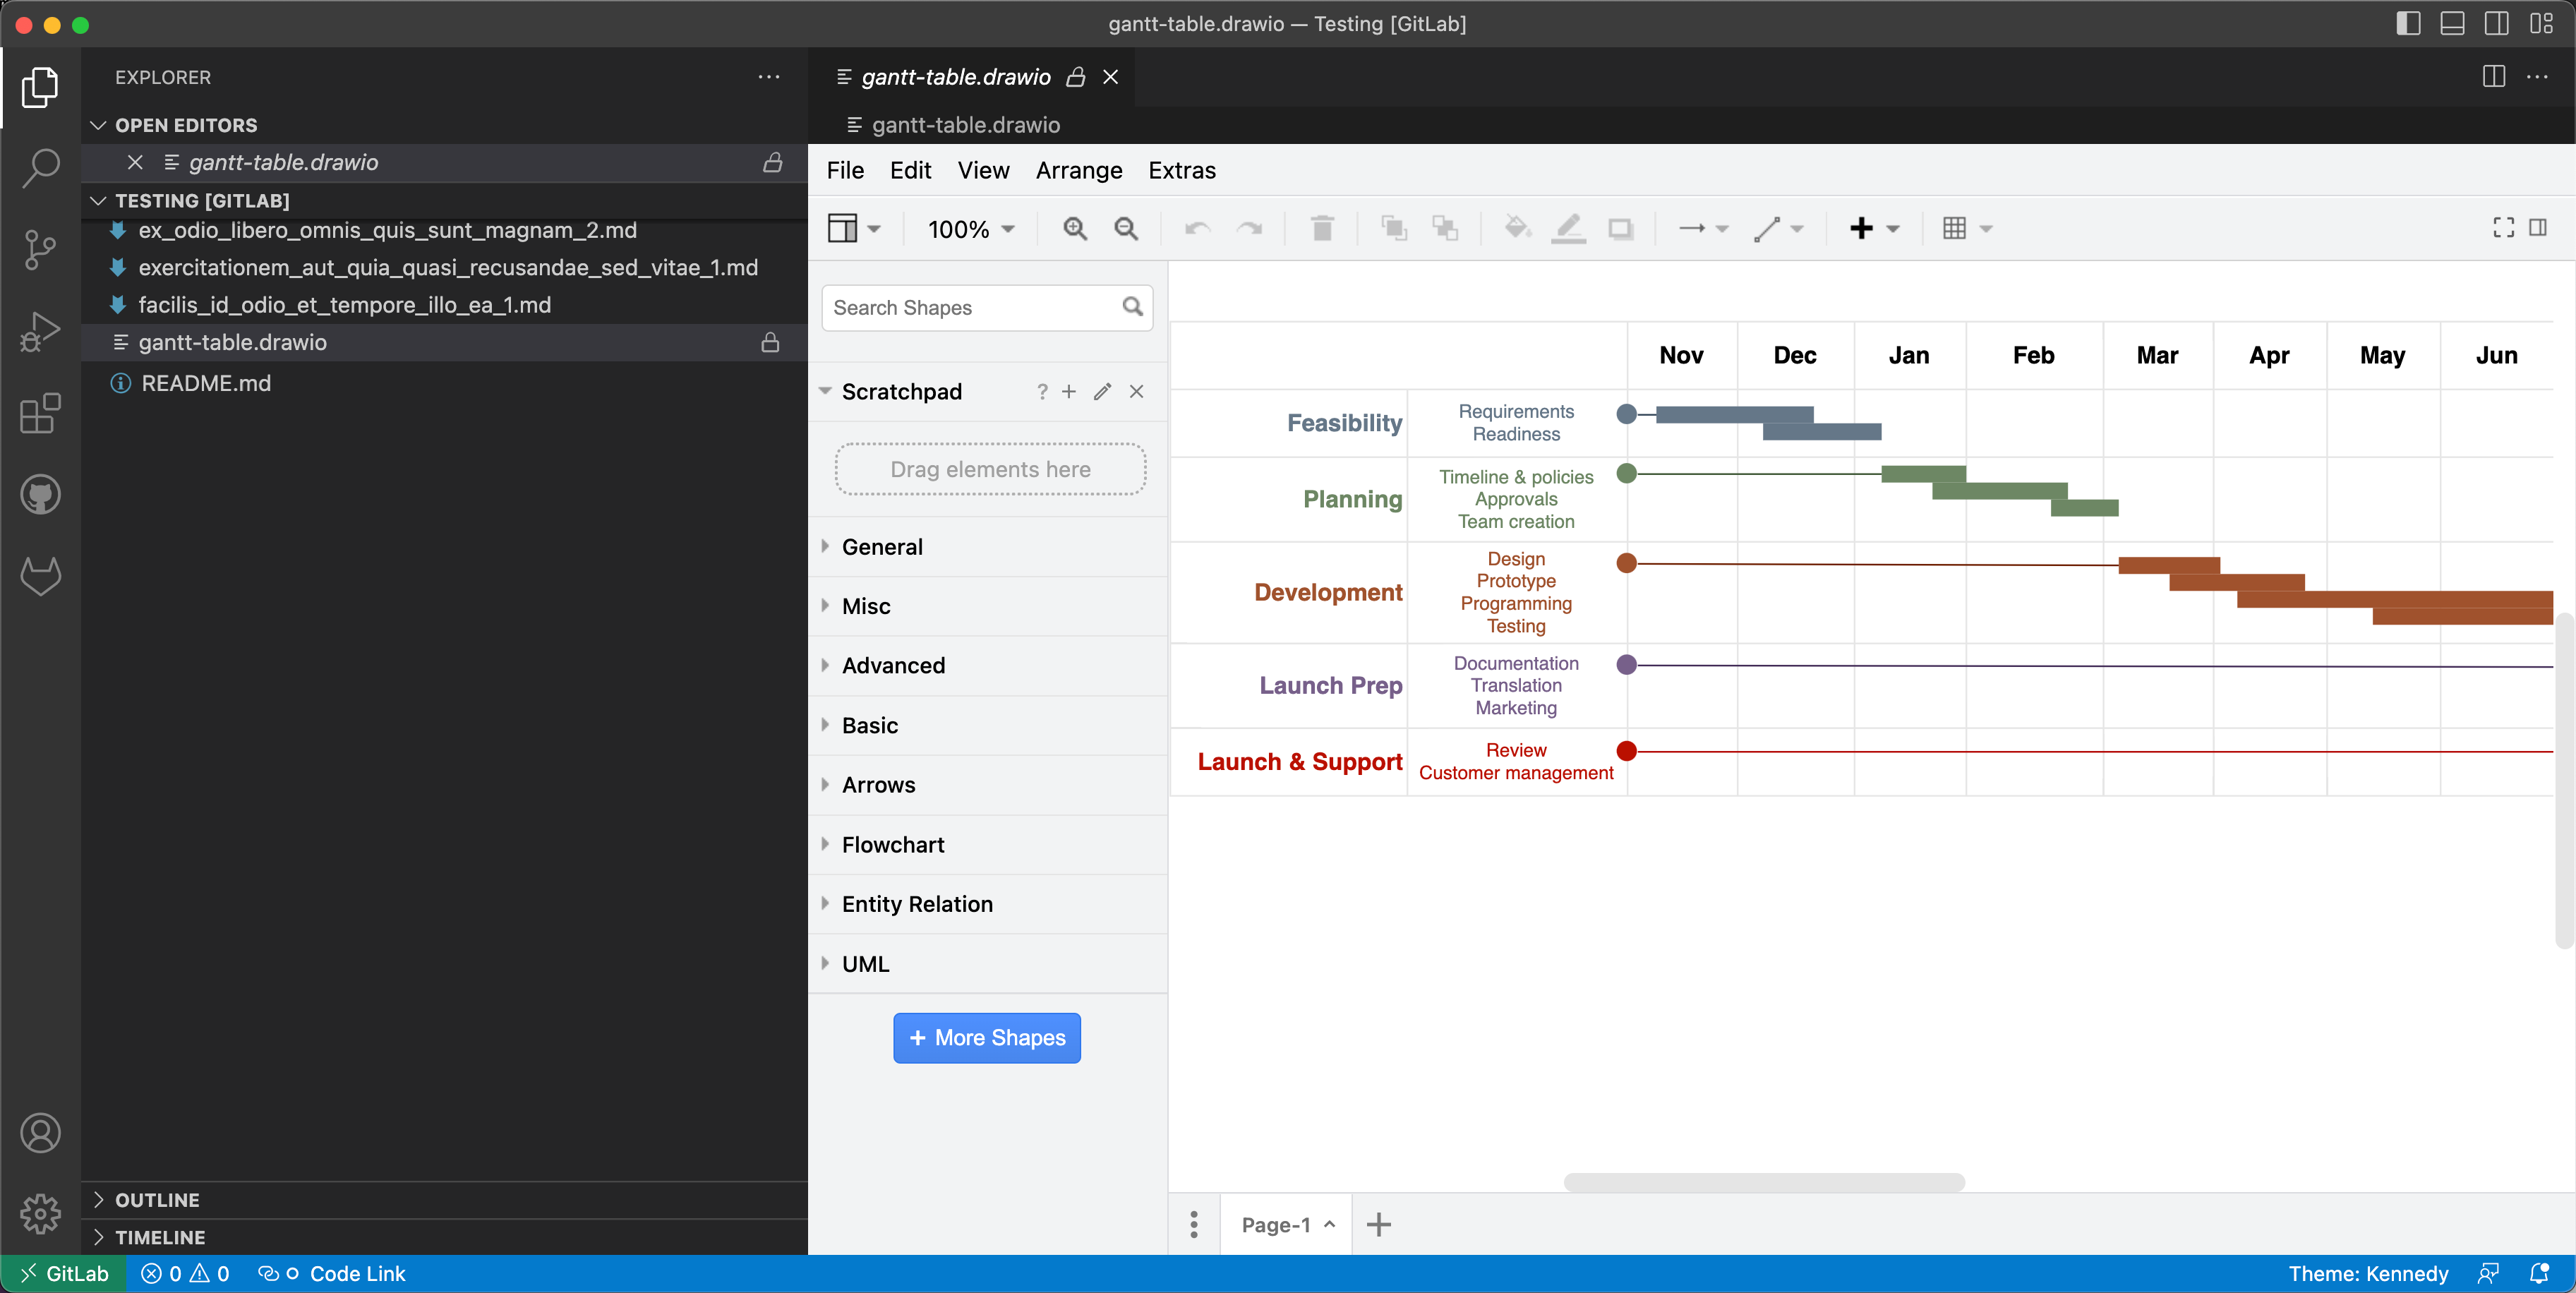
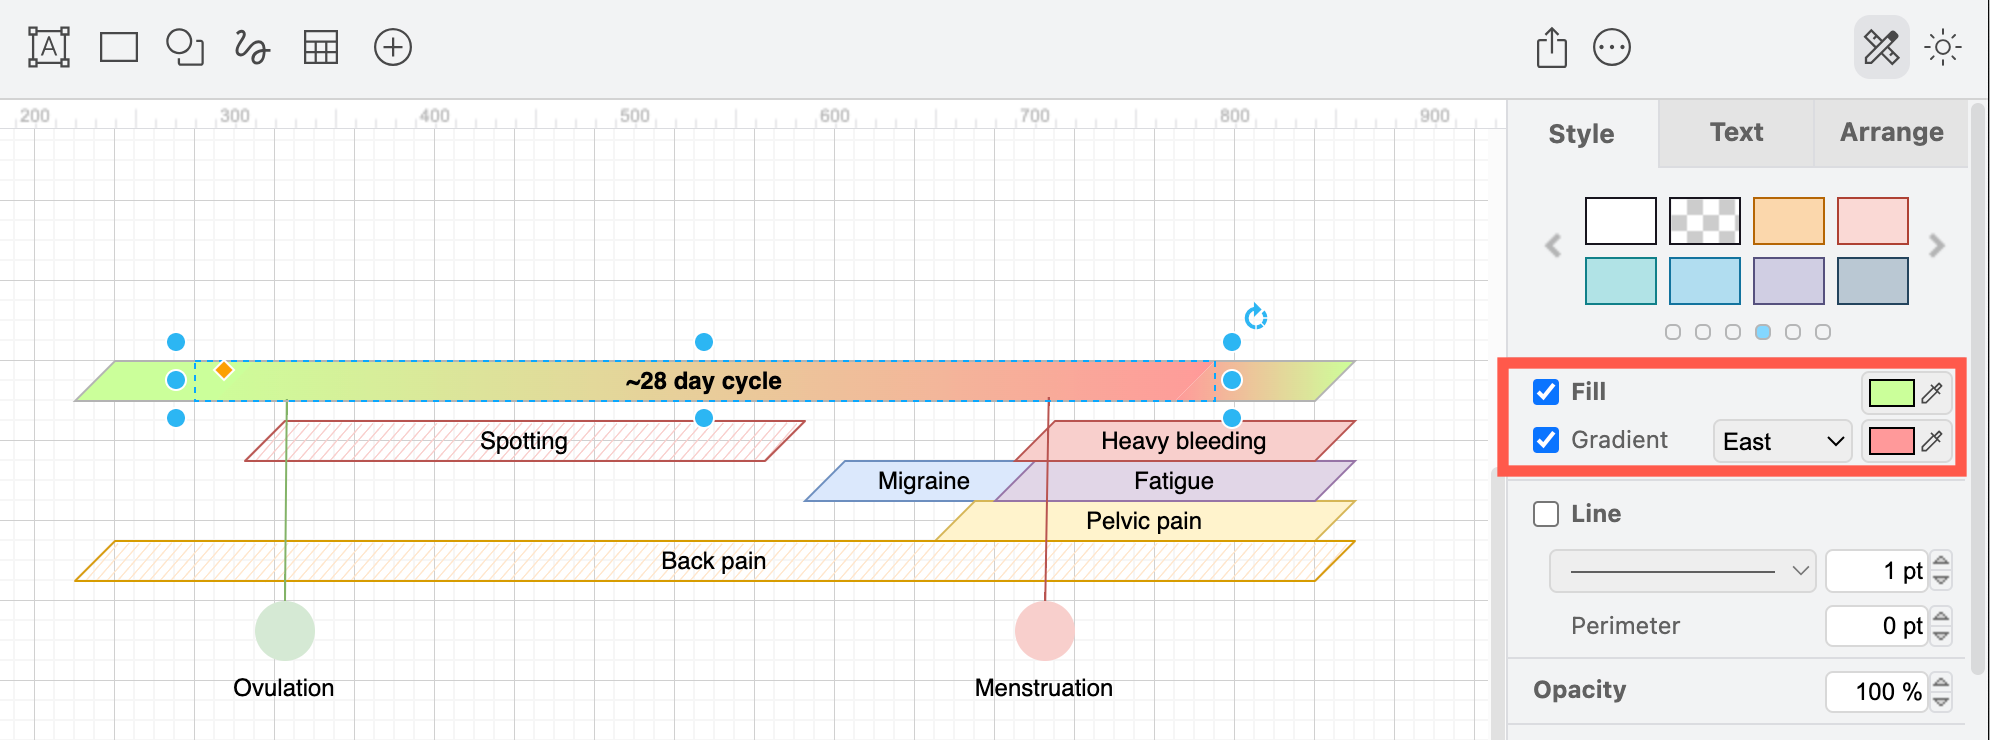
Timelines and symptom cycles

To show when symptoms started and how they have progressed, or how symptoms appear to worsen or get better in cycles, a timeline or a gantt chart is ideal.
A symptom graph noting common long covid symptoms - see it in a glance rather than a long spoken explanation

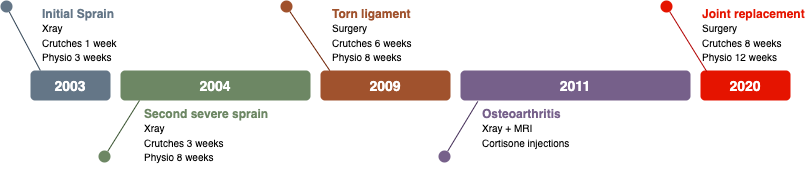
You could also use such a symptom timeline to show how a medication change has impacted symptoms - important when trialling which medication has the most positive effect.

If you have a recurrent problem that requires repeated surgeries or courses of hefty medication, a visual timeline avoids having to explain a lengthy treatment history in conversation, where things are likely to be forgotten or out of order. Use a gradient fill colour to show how symptoms worsen or improve during the cycle.
Draw a cyclic timeline to show symptoms that appear on a regular schedule

You will need a few cycles of tracking and recording your symptoms to discover a pattern, but doctors say they find this type of diagram helpful for both diagnosis and treatment.

Triggers vs symptoms

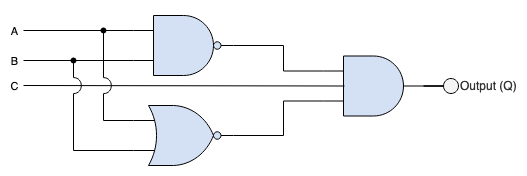
There are a number of ways to visualise symptoms that are not tied to a timeline or periodic cycle. You could use a cause and effect diagram like the one below, a concept map or mind map, a cluster graph, relational graph - anything that shows how your triggering situations or substances relate to symptoms.
An Ishikawa or cause and effect diagram is well suited for diagramming triggering situations for medically significant symptoms

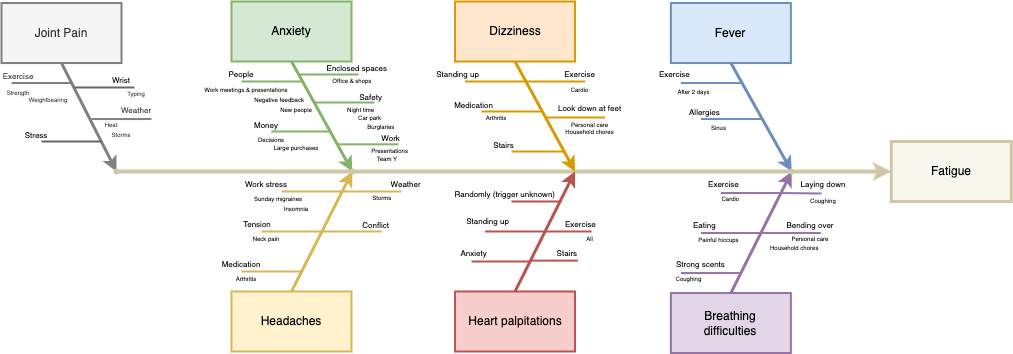
Take the time to record when symptoms appear and what caused them. This is increasingly important with the rise of long covid and other post viral problems, as well as for diagnosing arthritis and other autoimmune diseases, and non-specific chronic pain issues.

T-charts and Venn diagrams also let you quickly and visually sort a list of treatments, situations or medications into categories - those that improve or worsen symptoms, or have no impact.

More diagrams for patients

There are many other types of diagrams that may be useful, especially if you are attending a doctor's consultation online.

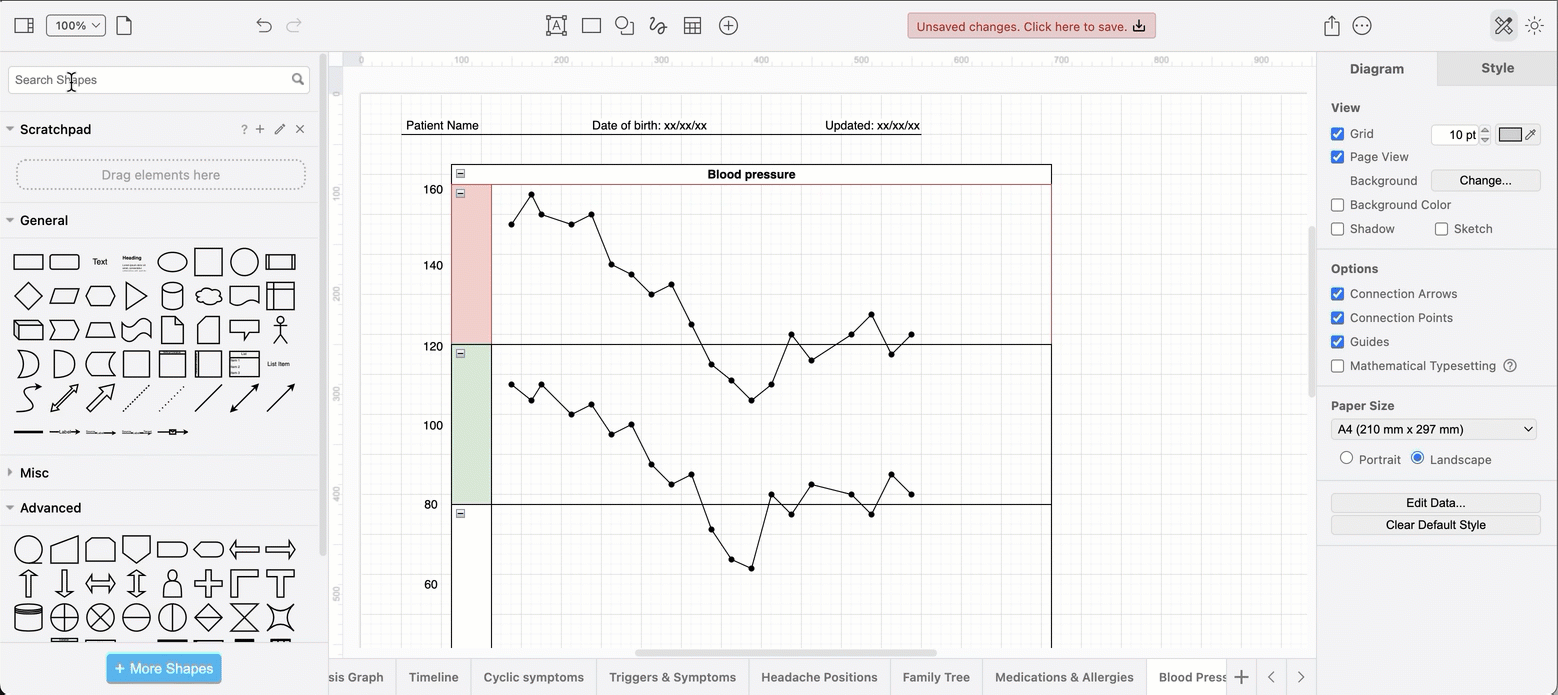
A chart of blood pressure values, or weight over time. If you use a smart blood pressure monitor, export the graph from your monitoring app as an image and drag the image onto the drawing canvas in draw.io.

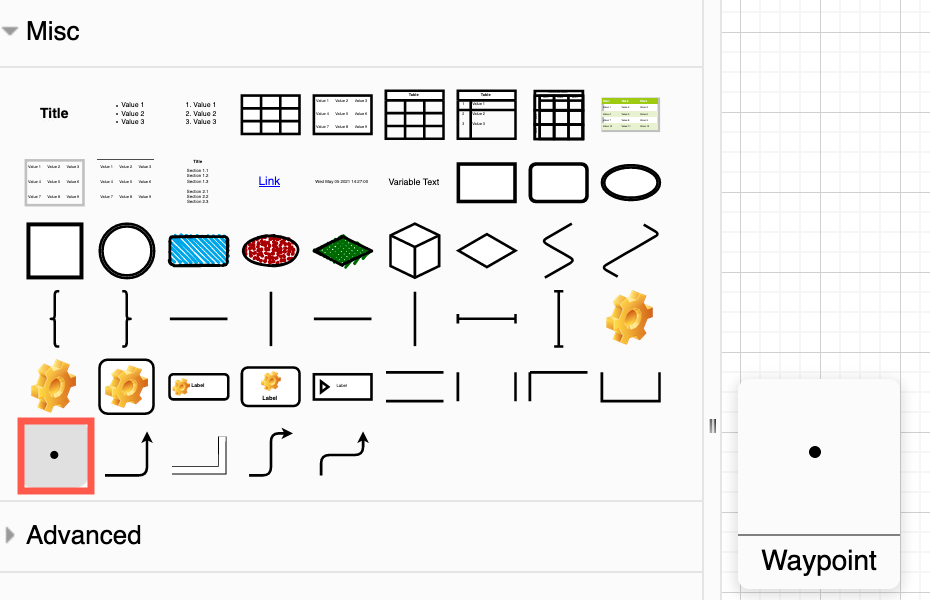
Or, track it yourself directly in draw.io using a Pool shape from the Advanced shape library and the Waypoint shape (via a shape search) for each value.
Create a graph with the waypoint and pool shapes in draw.io

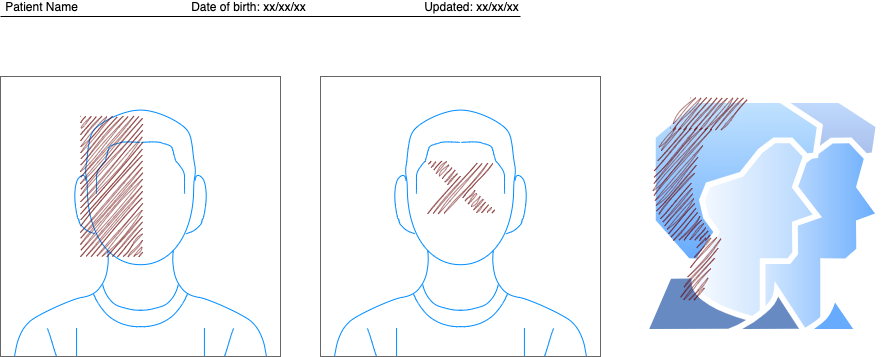
A labelled photograph or illustration showing exactly where the symptom occurs, or a freehand sketch. The example below uses shapes from the draw.io library (search for user) with basic shapes on top filled with the sketch style to indicate where different types of headache pain is located.
Label any illustration to visually demonstrate your symptoms

Organise and update your medical diagrams

Turnover of staff and short leaves of absence in medical clinics has increased in recent years. Which means, you will likely not see one doctor regularly. That makes it more important for you as the patient to be able to explain your medical history quickly to any new doctor - diagrams will help you do this.

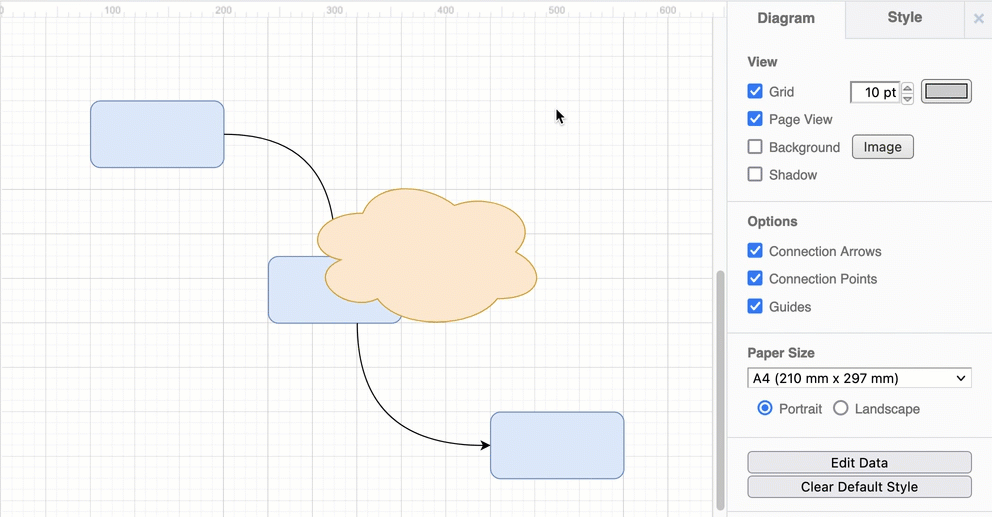
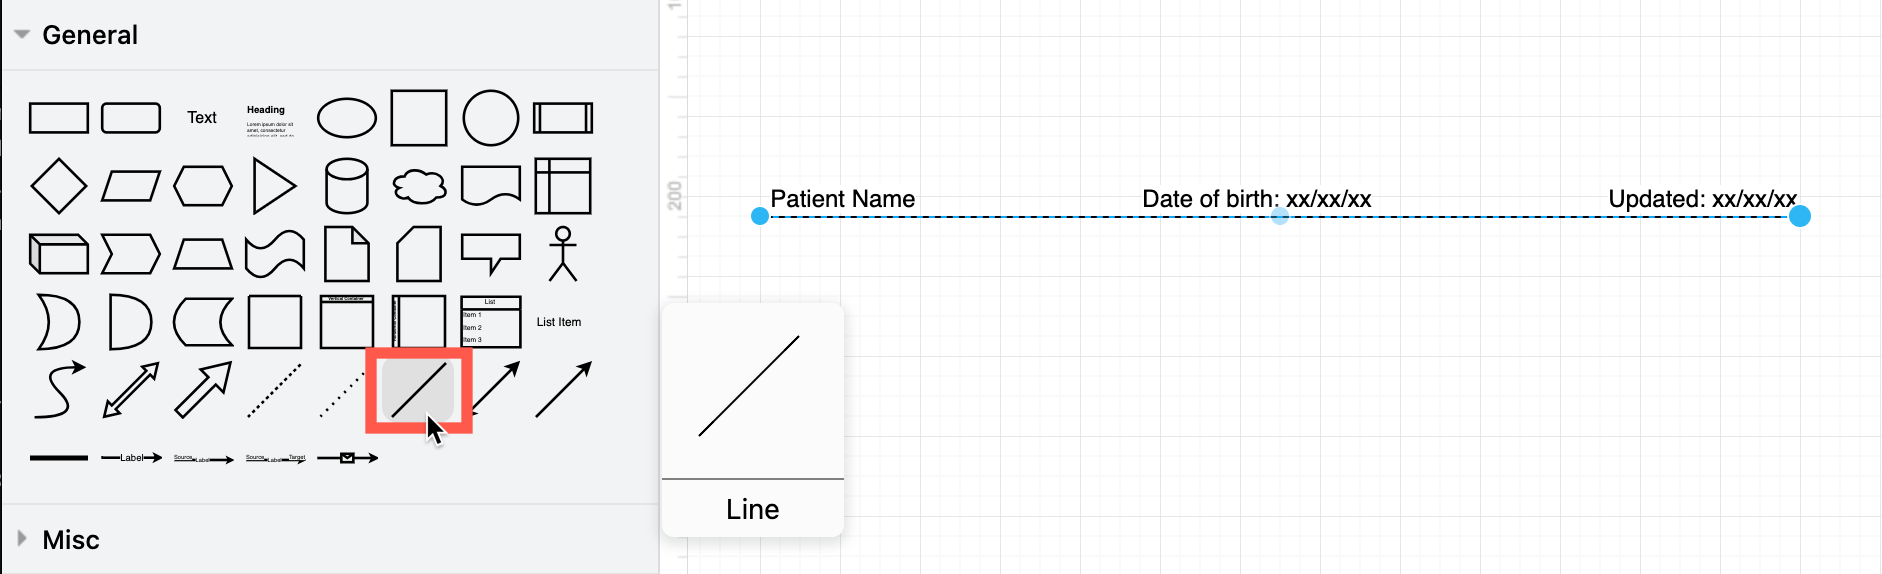
Include your name, date of birth and the date you updated the diagram on each page - this helps doctors associate a health record with a patient. Use a plain connector with three labels as it is easy to copy.
Add your name, date of birth, and the date you updated each diagram on the three labels of a plain connector

More diagramming tips for patients

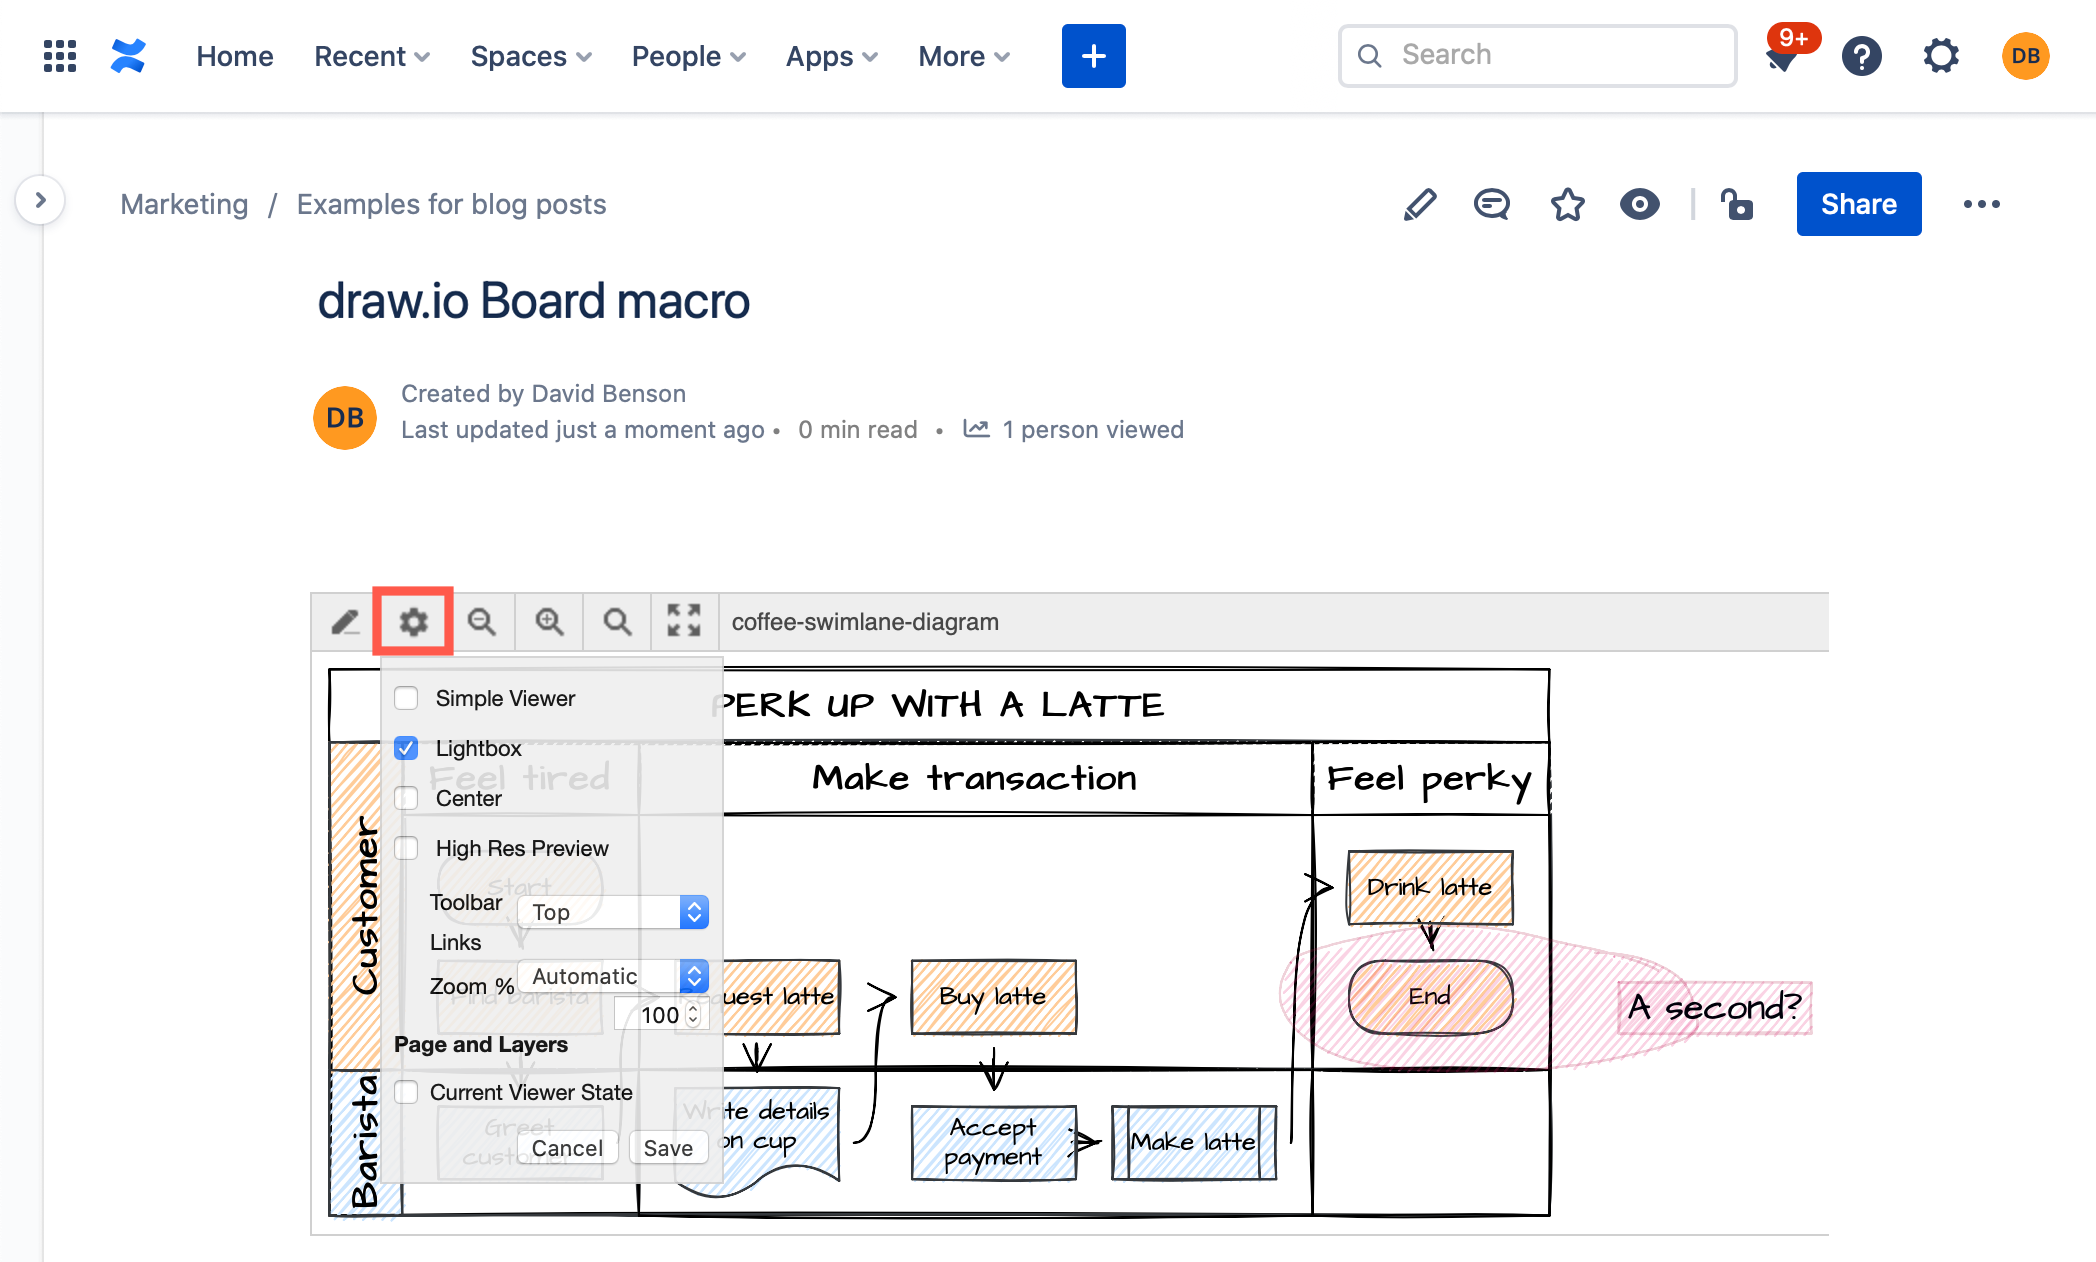
  • Encourage your doctors to scan these diagrams, especially if they need to review your history without you present for insurance or welfare purposes.

  • Use one multi-page diagram for your medical diagram - you won't have to hunt through files to find all the relevant information.

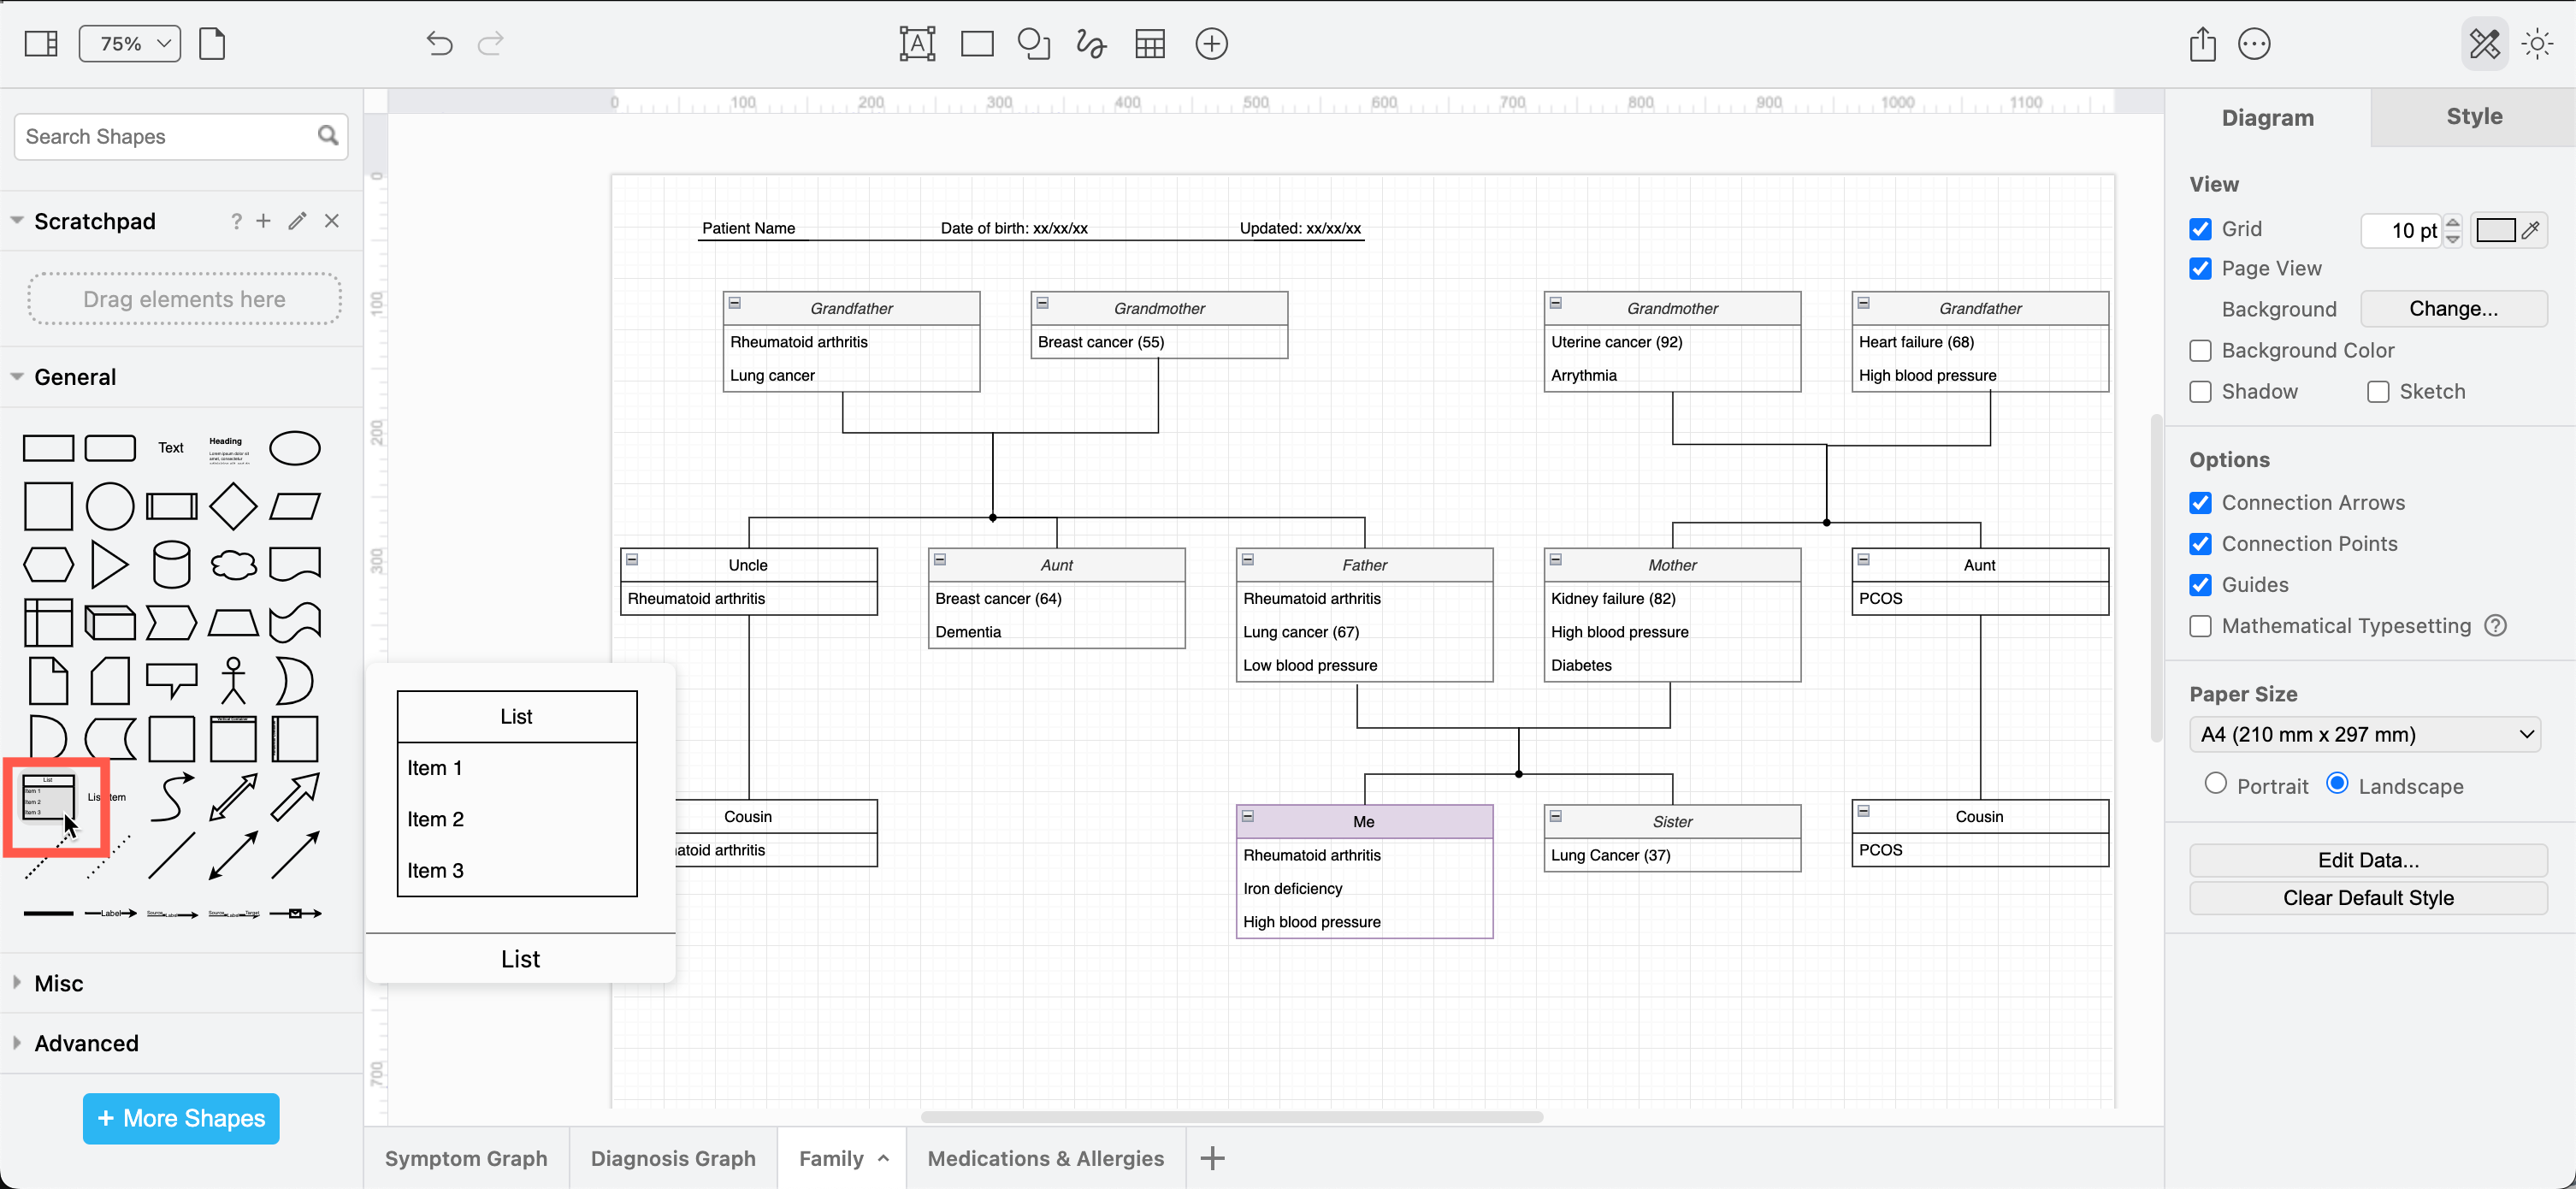
  • If you are dealing with inherited or genetic diseases, use the list shape in the General shape library to model a family tree of diagnosed related illnesses.
    Draw your family tree to see which conditions may have a genetic component

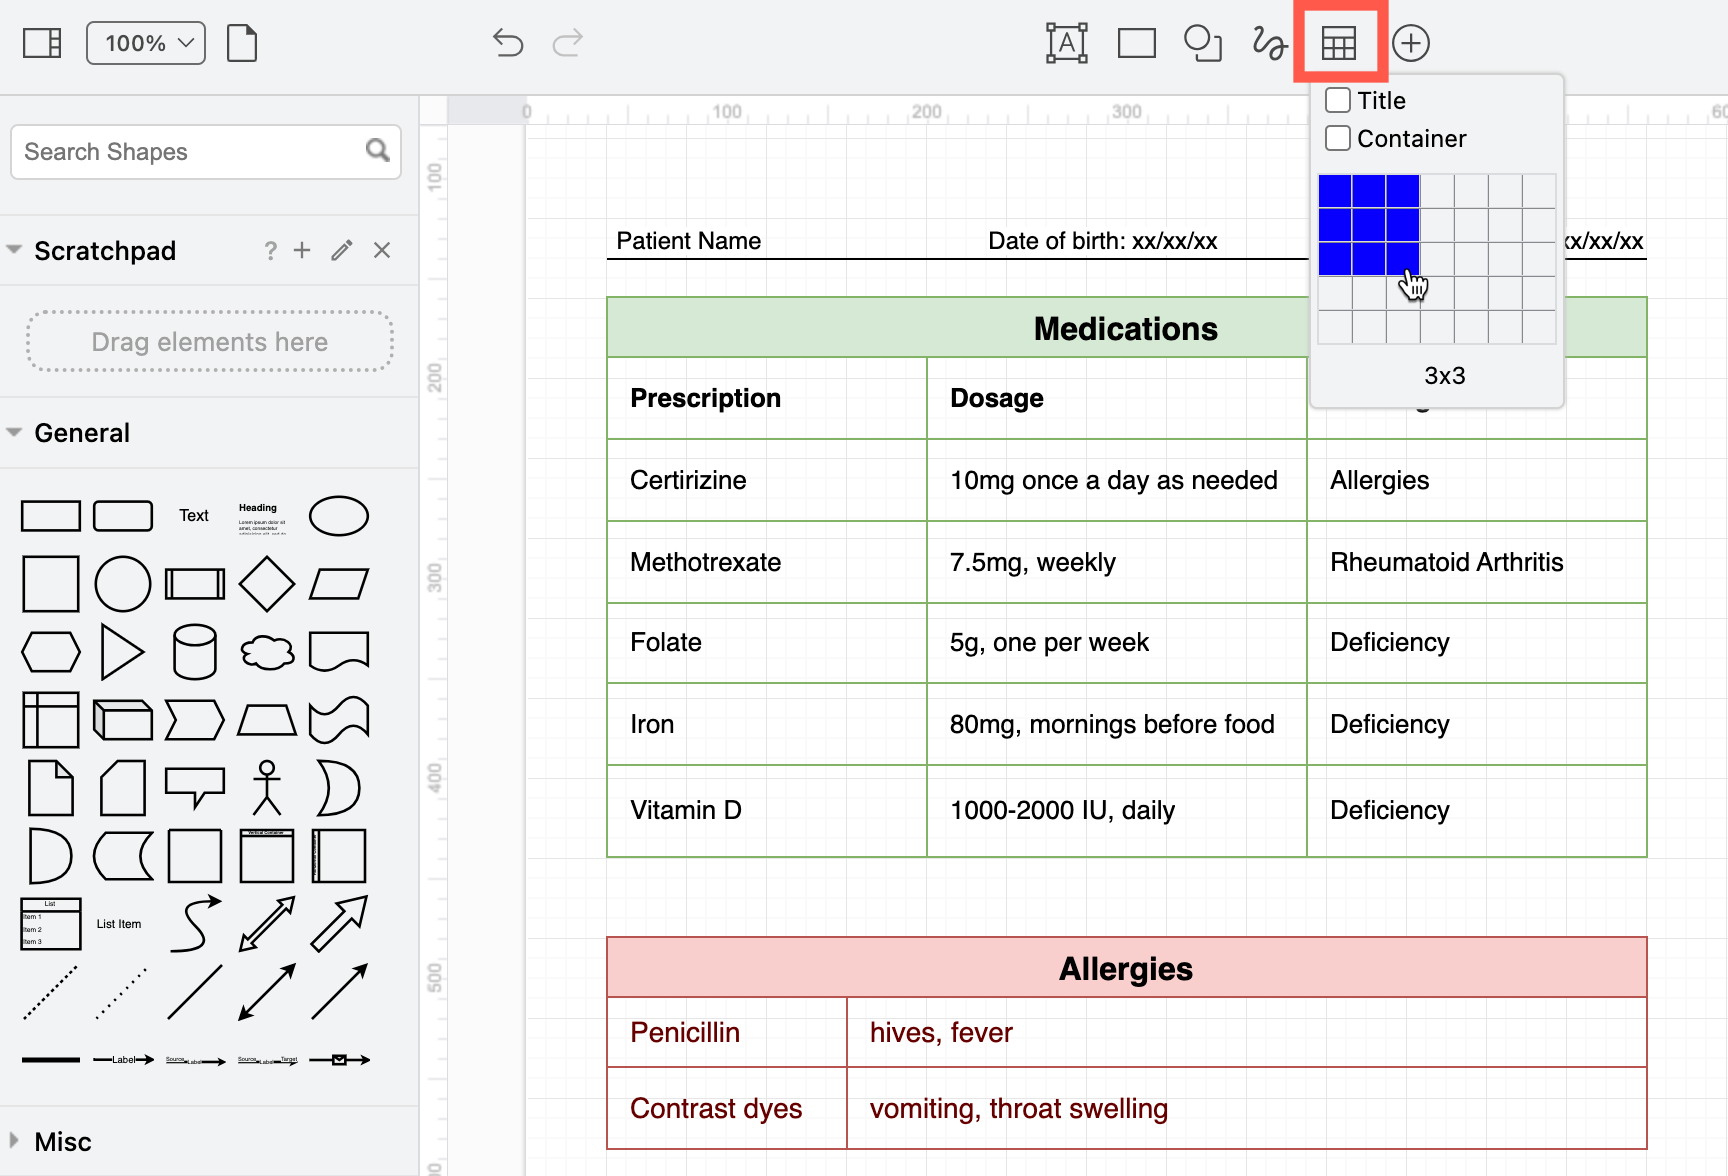
  • Use a table shape to record your medication schedule and allergies on one of the diagram pages.
    A table shape is an easy way to record medications and allergies

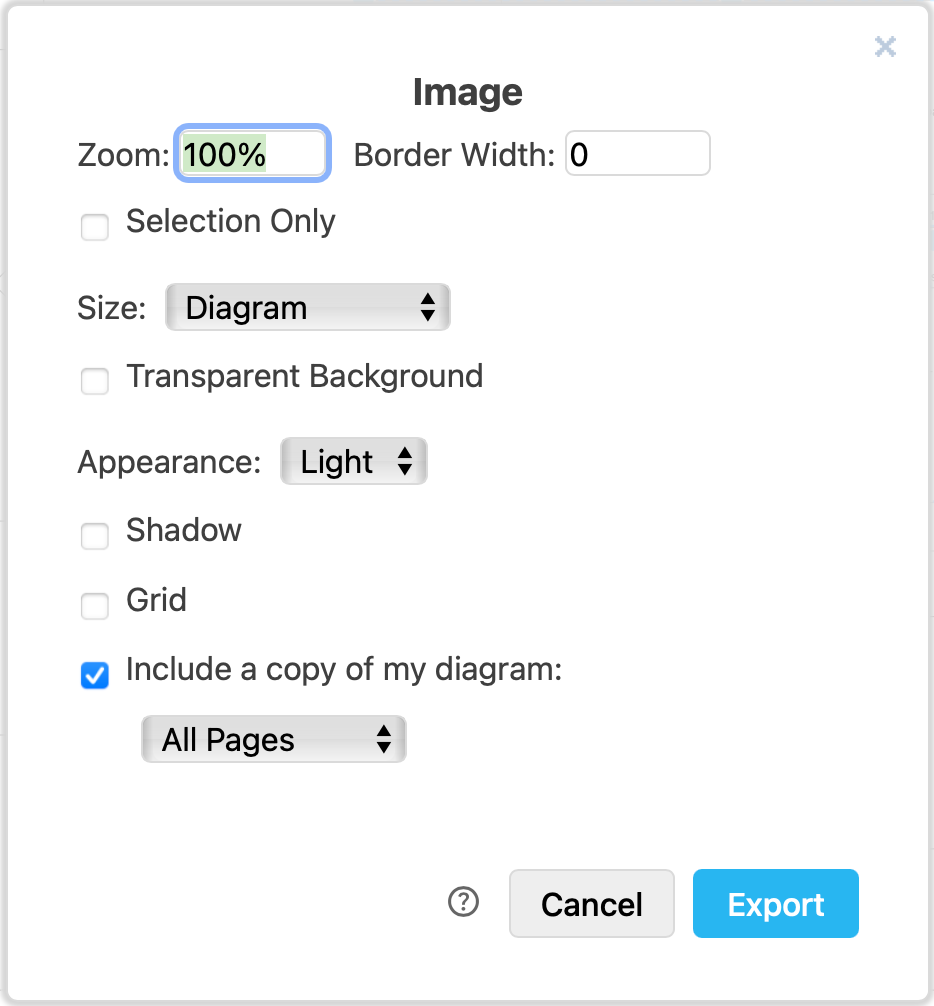
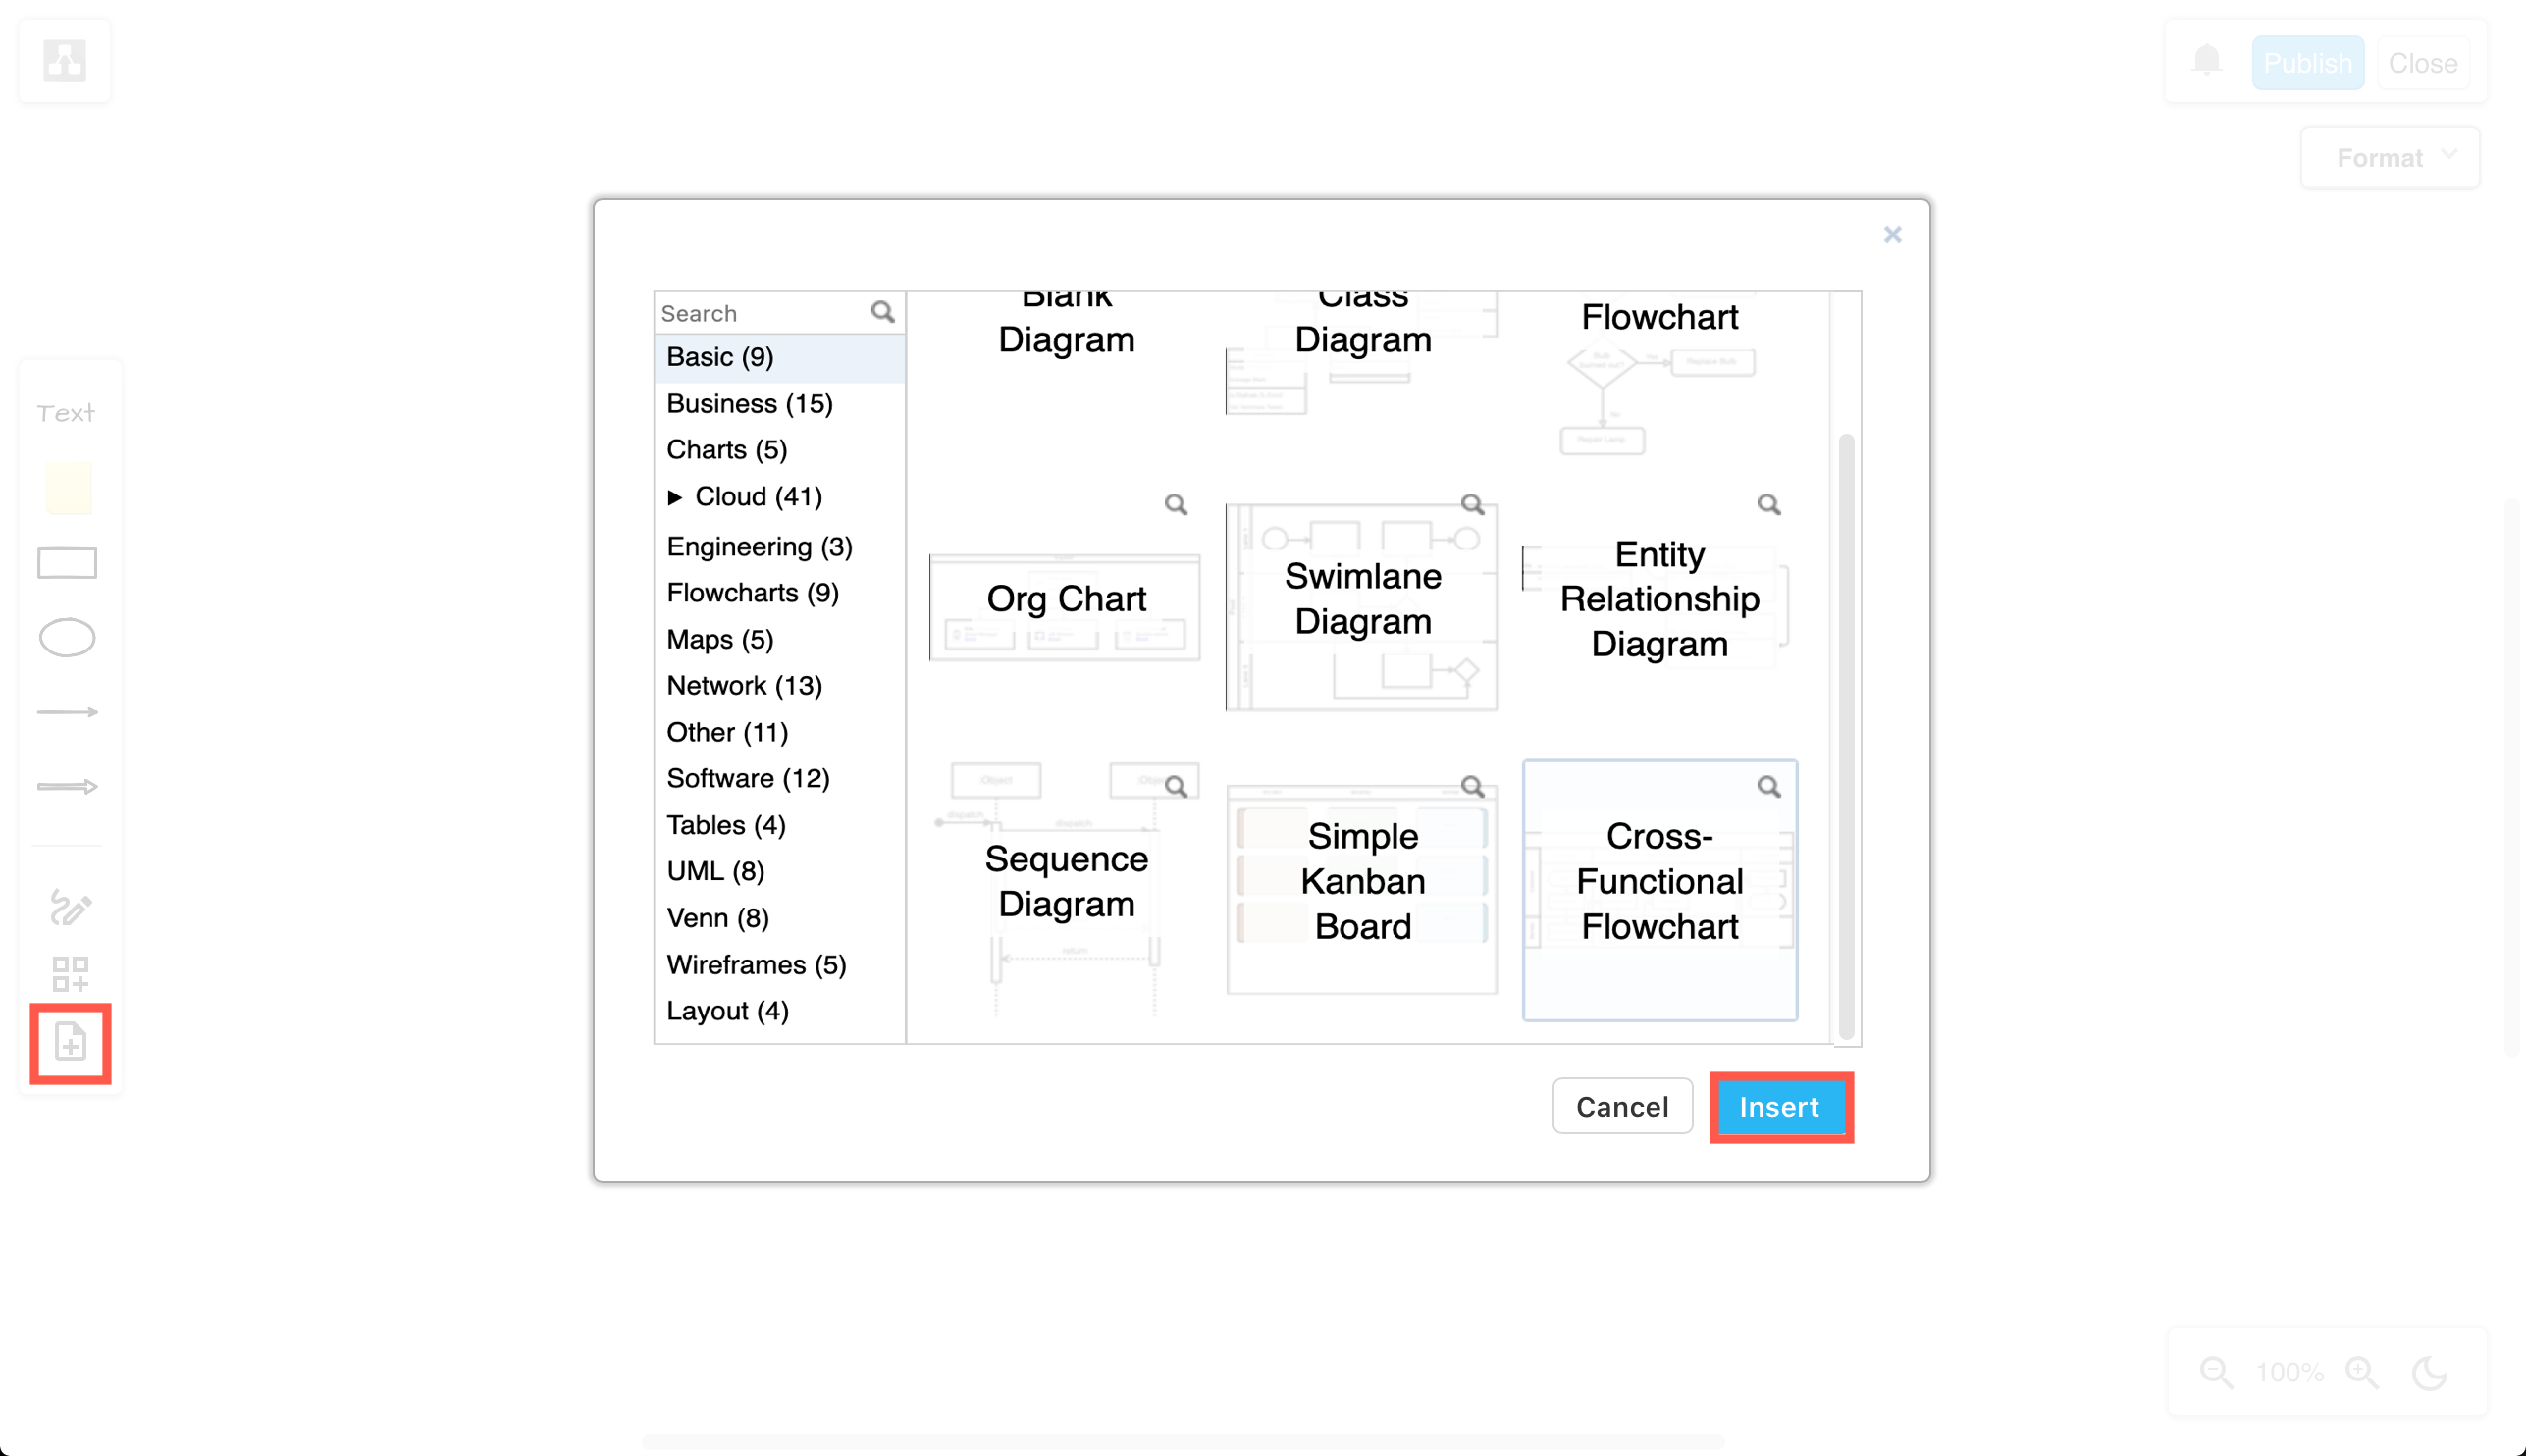
  • Export each page of your diagram to an image (PNG) to print it neatly on one neat page and include the diagram data - this will include all diagram pages, although only one will be shown in the image. You can then reopen the PNG image in draw.io later to update your multi-page diagram.
    Choose the export settings for the PNG image

draw.io automatically applies your Jira Cloud theme to diagram thumbnails

· 4 min read
draw.io
draw.io Team

Atlassian has just released a dark theme for Jira Cloud for users who don't like working on light backgrounds. With Jira's new dark theme, draw.io diagram thumbnails in a Jira issue now automatically reflect your selected theme.
draw.io automatically changes the colours in your diagrams to match your Jira Cloud dark or light theme

draw.io has had a dark mode for some time, but diagrams attached to Jira issues displayed on a light background, whether or not you were using the dark mode in the draw.io editor.

Learn more about diagramming with draw.io in Jira

Diagrams on dark backgrounds

draw.io makes an intelligent guess about text and shape fill colours to keep your diagrams readable when you switch between dark and light.

As your team members can use their preferred dark or light theme, and the diagram thumbnail will match their theme, it's best to double check that your diagram is easy to read in both dark and light mode.

  1. Click on the Edit pencil in the toolbar when you hover over diagram thumbnail in a Jira issue to edit it with draw.io. If you don't see this section, click on the draw.io section at the top.
    Click on the edit button when hovering over a diagram in a Jira issue to open it in draw.io
  2. Click on the sun or moon in the top right to switch to the opposite theme - either Dark or Light_ - and check that your diagram is still readable on that background.
    Click on the sun or moon in the top right of the draw.io editor to change the editor mode to dark or light

Choose Automatic to make the draw.io editor automatically match your operating system's mode (dark mode or light mode).

Note: Switching to dark or light mode in the draw.io editor will not affect the thumbnail on the Jira issue - whether it appears on a dark or light background is based on the Jira theme that the user looking at the issue has chosen.

To use draw.io in dark mode on the web, go to app.diagrams.net/?splash=0&ui=dark, or switch modes via the sun/moon icon in the top right or via the draw.io menu.

Set specific colours in a diagram

Colours in certain types of diagrams may have specific meanings - if you change their colours when adapting to dark mode, the diagram might not make sense.

If you want your diagram to only ever be on a dark or a light background and not automatically adapt colours to match the user's Jira Cloud theme, you'll need to set a background colour, as well as a specific colours for both light and dark modes on the shapes, connectors and text in your diagram.

  1. Open the diagram from the Jira issue in the draw.io editor.
  2. Make sure nothing is selected in your diagram, then enable the Background checkbox in the Diagram tab in the format panel.
  3. Click on the colour button, select a colour from the palette or enter a colour code, and click Apply. Open the Advanced drop down and set the same colour as the dark mode background colour.
    Adding a diagram background ensures your diagram looks the same in both Jira's light and dark themes
  4. Style the shapes and connectors via the Fill and Line colours in the Style tab. Make sure you set both the light colour at the top, and the dark mode colour (under Advanced). Style all text labels via the Text tab.

Now, your diagram will use your defined colours in both dark and light mode.
Adding a diagram background ensures your diagram looks the same in both Jira's light and dark themes

Using diagrams with GitLab

· 4 min read
draw.io
draw.io Team

draw.io will be available as an integration in the web-based GitLab Wiki editor on 22 March with the GitLab 15.10 release and product kickoff. When you add your diagram to a GitLab Wiki page while editing the source of that page, it will be saved as an SVG image containing the diagram code, and displayed in the page content.

Like all files in GitLab, the image with its embedded diagram is versioned, so all changes are tracked.

Note: As this integration is still under development until release, small changes may be made.

Diagram in the GitLab Wiki editor

Add a new diagram: Click on Insert or edit diagram in the toolbar in the Markdown editor.
Add a diagram to GitLab in the Markdown editor

A blank diagram will be opened in the Sketch whiteboard-style editor theme. Use the diagramming toolbar on the left to access templates and shape libraries.
Create your diagram in the Sketch whiteboard-like editor, and save it to return to the GitLab Markdown editor

Save your diagram: It will be added to the page in Markdown as a .drawio.svg file.

Edit an existing diagram: Make sure your cursor is in the diagram file entry in the Markdown code, and select Insert or edit diagram.
Make sure the cursor is in the Markdown reference to the diagram file then edit the diagram in the GitLab Markdown editor

View a diagram in the page: Click on Preview to render the page containing the diagram.
Preview the page to see how the diagram is rendered along with the markdown text content of the GitLab Wiki page

Diagram with the GitLab rich text editor

Edit a diagram: Select the diagram, and click on Edit diagram in the hover toolbar that appears above or below.
Click on a diagram and use the hover toolbar to edit it in the GitLab rich text editor

Add a new diagram: Make sure no other diagram is selected, then click on the + in the toolbar and select Create or edit diagram.
Make sure you have not selected any diagram, click on the + in the toolbar and select Create or edit diagram to add a new diagram in the GitLab rich text editor

Save individual diagram files to GitLab

You can also store your individual diagram files in GitLab. Select GitLab as the save file destination when you create a new diagram, or select Save as from the menu.
Select GitLab as the location where you want to store your files

Alternatively go to our online editor to start diagramming now using GitLab to store your diagrams.

You'll need to authorise access to your GitLab repositories, if you haven't already done so.
Authorize GitLab to save diagram files to this location

Tip:i As draw.io uses secure direct client authorisation, your password is never shared.

Diagram in VSCode with GitLab

  1. Set up the GitLab Workflow extension for Visual Studio Code.
  2. Install Henning Dieterichs' unofficial draw.io extension for Visual Studio Code

The draw.io extension for VSCode lets you view and edit the .drawio diagram files stored in your repositories.
Use the unofficial draw.io extension for VSCode to edit .drawio files stored in a GitLab repository directly in the Visual Studio Code editor

See how this extension works in GitHub - it works in a similar way with GitLab inside VSCode.

Note: The extension only recognises files with the .drawio file extension.

Keep a draw.io diagram out of the recent diagrams list and search results with a sensitive label

· 3 min read
draw.io
draw.io Team

When you apply a sensitive label to a draw.io diagram in Confluence Server/Data Center, it will not be listed as a recent diagram or in the diagram search results when creating a new diagram or embedding a diagram.

Note: This is a new feature for draw.io in Confluence Server/Data Center version 8.x. It is not yet available in draw.io for earlier versions of Confluence Server/Data Center or in Confluence Cloud.

Why is this useful?

Use the sensitive label to ensure that draft diagrams are not copied or embedded until they are finalised or approved, and the label on the diagram file attachment is removed.

Mark a new diagram as sensitive

At the bottom of the new diagram dialog, enable the Mark as sensitive checkbox.
Mark a new diagram as sensitive when you create it to hide it from the recent diagrams list and search results

For example, the circle diagram on this page was marked as sensitive. You can see this via the labels in the page attachments list.
Confluence page attachments where the circle diagram file has two labels - drawio and sensitive

Now when you create a new diagram or embed an existing diagram, you won't see this sensitive diagram in the recent diagram list. It will also not be shown when you search for the diagram's filename.
Diagram files that have the sensitive label will not be shown in the search results, even when you search for their exact filename

Add a sensitive label to an existing diagram

All draw.io diagram attachments on a Confluence page are given the drawio label by default. You can add a sensitive label to an existing diagram via the Confluence Server/Data Center page attachments.

  1. On the page that contains the diagram file, click on the three dots to open the menu and select Attachments.
    Open the page attachments on a Confluence Server/Data Center page to see all the diagram files attached to that page
  2. Find the name of the diagram file you want to mark, click on the label icon next to the existing drawio label.
    Click on the label icon next to the diagram file you want to mark as sensitive on the Confluence Server/Data Center page
  3. Type sensitive and click Add, then click Close.
    Type the new label 'sensitive' in the text box and click Add to add the new label to that attachment on the Confluence Server/Data Center page

Remove the sensitive label from a diagram

  1. Open the page attachments in the same way as above.
  2. Find the name of the diagram file, and click on its label icon.
  3. Click on the little cross next that is on the sensitive label to delete it.

Draw Azure architecture diagrams with updated shapes

· 7 min read
draw.io
draw.io Team

The Azure shape library in draw.io has been updated. You can draw Azure architecture diagrams for your cloud infrastructure from scratch, or import .vsdx files or exported diagrams from automated infrastructure documentation apps like Cloudockit.
Azure architecture diagrams are easy to draw with the hundreds of Azure shapes in draw.io

Open this Azure architecture example in the online draw.io editor

Draw Azure diagrams in logical blocks

You will likely never draw a single Azure diagram that contains all levels of detail. You can either start with the overview diagram and work from this top level down to the details, or bottom up starting with the logical blocks in your architecture.

  • Azure architecture overview diagram: Includes design principles and the broad choices of specific services in your subscriptions.

  • High-level Azure diagrams: Includes Azure services and their configuration, resource groups, virtual networks, and environments. Performance, regional service provision, availability zones, monitoring, backup and recovery services are included at this level of detail.

  • Low-level diagrams: These are less common, and usually document the specific details needed to implement the design and the continuous integration/continuous deployment pipelines.

Enable the Azure shape library

  1. Go to our online editor or open one of the draw.io integrations or our desktop app.
  2. Click on More Shapes at the bottom of the left panel.
  3. In the Networking section, click on the checkbox to enable the Azure shape library, and click Apply.
    Select the Azure shape library in the Networking section to use these shapes

The Azure shape library will load in the left panel, with its shapes separated into categories.
The Azure shape library is well organised into categories

Tip: You can also search for Azure using the Search Shapes text box to see a list of all Azure shapes not sorted in categories.
Search for 'azure' to see all the shapes without them being sorted into categories

Use the scratchpad

Many Azure architectures repeat sub-sections of the architecture for backup or redundancy purposes. Instead of placing copies, you can put that sub-section into the scratchpad.

  1. Select all the shapes on the drawing canvas that you want to repeat.
  2. Drag these onto the scratchpad in the left panel.

Click on the sub-section shape in the scratchpad to add it to the drawing canvas, or drag another copy from the scratchpad into position.
Use the scratchpad to quickly copy common subsections of your Azure architecture diagram

See how to use the scratchpad in draw.io

Use rectangles to indicate regions

Use rectangles from the General shape library to indicate a region. Once you've placed and resized a region shape, send it to the back on the Arrange tab of the format panel so that it is placed behind the Azure architecture's shapes.
Move region shapes to the back via the Arrange tab of the format panel, behind the other shapes in your Azure diagram

Next, update the rectangle style to separate regions in the Style tab of the format panel on the right.

  • Dashed outline - Change the Line of the region to Dashed using the dropdown list, and ensure the Fill checkbox is not selected to remove the background.
    Change the Style of basic rectangles in the format panel to indicate different regions in your Azure architecture

  • Coloured background - Click on the colour block to the right of the Fill checkbox and select a new colour from the palette. Ensure the Line checkbox is not selected or set the colour to match the fill colour.
    Change the Style of basic rectangles in the format panel to indicate different regions in your Azure architecture

Tip: Group all of the shapes contained within the region with the region rectangle so you can more easily move them together.

Draw connectors

Hover over any shape in the diagram to drag a connector from one of the four connection arrows, then drop it on another shape (or group of shapes) to connect the two.

Floating connectors: Floating connectors move around the perimeter of the shape intelligently as you reposition it on the drawing canvas. Drop the connector on the target shape when the outline is blue.
Use floating connectors to make it easier to move the Azure shapes around on the drawing canvas

Fixed connectors: Fixed connectors remain connected to a particular point on the target shape when you reposition it. Drop the connector on a connection point (a little cross) or when the outline of the shape is green.
Use fixed connectors to ensure a connector stays attached to that particular point when move the Azure shape around on the drawing canvas

Learn more about working with connectors in draw.io

Azure architecture templates

Several Azure diagram templates are available in the template library.

  1. Click Arrange > Insert > Template to open the template library.
  2. Expand the Cloud section and select Azure to see the Azure diagram templates.
    Start with a template for your Azure architecture diagram in draw.io
  3. Click on a magnifying glass in the top right of any template to see a preview.
  4. Select a template and click Insert to add it to the drawing canvas.
    Start with a template for your Azure architecture diagram in draw.io

Export and embed your Azure diagram

Select File > Export as from the menu.

Tip: Make sure you select the Include a copy of my diagram in the Image export options dialog to allow those you share it with to edit it.

Embed diagrams in the following documentation platforms

Gliffy vs draw.io - concurrent editing

· 4 min read
draw.io
draw.io Team

TL;DR : Gliffy on Confluence Cloud saves with last write wins, you lose data concurrently editing. draw.io supports real-time collaborative editing with shared cursors.

Gliffy vs draw.io for Confluence

When comparing diagramming apps, you'll see lists of standard Confluence-supported features - sharing, import and export, search, version history, customisation, security - and, of course, pricing.

Unlike Gliffy, draw.io has concurrent diagram editing. All team members' changes are merged and synchronised - visible to each other in the diagram editor.

When you choose to show your cursor, your team will see where you move your mouse and what you select, all in real-time.

Shared cursors mean better collaboration in draw.io for Confluence

Each person who is editing a draw.io diagram in Confluence is assigned a colour. Cursors are shared by default - you'll see everyone's name with their mouse pointer as they move around and edit the diagram.
Share your mouse cursor with others who are editing the same draw.io diagram in Confluence Cloud

Additionally, when you select a shape everyone else will see it highlighted in your colour.

Don't lose diagram data - use draw.io

More importantly than seeing a mouse cursor in real time, you don't want to lose any changes as you collaboratively edit a diagram.

That's why draw.io merges and synchronises the changes while you are editing. You don't even have to publish the diagram to Confluence to see everyone's changes in the editor - draw.io saves and synchronises automatically.
When multiple people edit draw.io diagrams in Confluence, share cursors to see their mouse movements and selection. As changes as they are made, they are saved and synchronised to your editor.
Recorded using two different devices, both editing the same draw.io diagram file in Confluence Cloud. Changes are constantly merged and the draw.io diagram is updated in the editor in real time.

Now, let's contrast the collaborative editing process in draw.io the animation above with editing a diagram in Gliffy.

Gliffy vs draw.io - when a team edits a diagram

The following example shows that you can't see the changes made by others while editing the same Gliffy diagram in Confluence, and that Gliffy follows a last-write-wins approach.

1: Person A adds a shape and publishes the edited Gliffy diagram, then returns to Confluence to view it.
2: Person B was already editing the Gliffy diagram file, so doesn't see the added shape, or that any changes were made by another person.
3: Person B deletes an existing shape and publishes their version, returning to Confluence to view it.
4: Because Person B's Gliffy diagram was the last to be published, it overwrites and ignores the changes made by Person A.

Recorded using two browser windows, both editing the same Gliffy diagram file in a Confluence Cloud instance

Person A must now manually refresh their browser tab to see the updated Gliffy diagram. Only then will they see that their changes have been overwritten by Person B.

Person B remains unaware that another person had edited the Gliffy diagram.

Use draw.io to avoid this problem - share your cursor and let others see you collaboratively edit a diagram in Confluence.

Reporting issues, suggesting features and upvoting

· 6 min read
draw.io
draw.io Team

We've recently implemented a number of features, most popularly requested via our drawio Github repository. To reach support at draw.io for diagrams.net and our draw.io apps, please read and follow the instructions on our support page.

Skip to the end of this post to see how to upvote existing issues and feature requests.

Tip: To use the updated features in our online editor, clear the draw.io cache in your browser (clear.diagrams.net), then reload the draw.io editor.

Crop images in the diagram editor

You can now crop images in the draw.io editor. This works on both images imported into the editor from your device, as well as images embedded from a URL.

  1. Right click on an image and select Crop.
  2. Resize the crop using the grab handles and drag the crop box to reposition it.
    • Click on Ellipse to use a circular or ellipse-shaped crop.
    • Click on Rounded to round the corners on the rectangular crop.
  3. Click on Apply
Crop an embedded or imported image in draw.io

This is a non-destructive crop. To reset the crop to the original image, click on Reset in the crop image dialog.

Merge and unmerge table cells in the Sketch editor theme

Merge and unmerge table cells using the Table tool on the toolbar in the Sketch editor theme - our uncluttered online whiteboard theme.

These options only appear when you have selected multiple table cells or a previously merged table cell.

Merge two or more table cells

  1. Select two or more adjacent table cells (hold down Shift and click on multiple cells).
  2. Click on the Table tool in the toolbar and select Merge. Alternatively, click on Merge in the Arrange tab of the format panel.
    Merge table cells in the Sketch whiteboard-like editor theme in draw.io

Unmerge merged table cells

  1. Select the merged cells in the table.
  2. Click on the Table tool in the toolbar on the left and select Unmerge.
    Unmerge table cells in the Sketch whiteboard-like editor theme draw.io

In all of the editor themes, you can also unmerge merged table cells via the Arrange tab of the format panel.
Unmerge table cells in the draw.io editor via the Arrange tab in the format panel

SVG export options for formatted text

Previously, draw.io exported shapes and labels with HTML formatted text embedded as a foreign object in the SVG. This displays fine in browsers, but a number of users had issues with exporting and editing in SVG editors, which wasn't a use case we had considered.

Now, you can choose how formatted labels should be exported, and whether the SVG file it should contain a warning about the text not being SVG.

For example, in the following diagram, some of the shapes have bold and italic words in the label text - they use formatted text.
You can use different formatting options inside a text label - on part of the label only

When you export this diagram as a SVG (File > Export as > SVG), you can now choose the Text Settings.

  • No Change includes the warning embedded in the raw SVG data (default).
  • Embed Fonts includes the fonts in the exported SVG file in case the viewer doesn't have the font installed.
  • Convert Labels to SVG transmits the diagram to our servers, generates a PDF, then pipes that through Inkscape, and returns the SVG output.
    Choose how to export formatted text labels when exporting to a SVG file

Note with this last option:

  • You transmit the diagram to our servers. Diagram data is not stored after this PDF/SVG conversion has finished and the SVG output is returned.
  • The text is converted to a path. Screen readers can't read it and you can't select it.
  • The file size will be larger.

To report a bug or request a feature

If you are using our draw.io apps in Atlassian Confluence or Jira, please contact your instance administrator for details of your support entitlement.

For our online diagram editor and any of the draw.io integrations that we support via our open source project, follow the steps below.

Go to the Issues tab in our drawio GitHub repository and first search through the list of existing issues to see if your issue or idea has been previously posted.

Upvote an existing issue or feature request

If you find an existing issue related to yours:

  1. Click on the issue title to see the full issue description.
  2. Click on the emoji icon at the bottom of the description, and select the 'thumbs up' icon.
    Register that you also have a reported bug or want the requested feature in our drawio repository on GitHub

This will ensure that the most popular bugs and feature requests get pushed to the top.

Raise a new issue or request

If you have a question, rather than want to report an issue or request a new feature, please look under the Discussions tab in our Github repository.

  1. From the Issues tab in our drawio GitHub repository, click on New issue.
  2. Click on Get started next to either Bug report or Feature request.
  3. Enter a clear and unambiguous title for your bug report or feature request.
  4. Follow the instructions and fill in the Preflight Checklist in the large text field.
  5. Describe your problems or suggested feature in the appropriate sections of the checklist, clearly and in detail.
  6. Click Submit new issue when you have finished.
    Register that you also have a reported bug or want the requested feature in our drawio repository on GitHub

New draw.io features and updates in 2021

· 9 min read
draw.io
draw.io Team

This past year has seen a number of new features and big updates to draw.io, including the online editor, our Confluence and Jira apps, and other integrations for a variety of platforms.

Data security and privacy

As a unique security-first diagramming app, we want to provide you with the best in data privacy and data security.

Building on the data governance and lockdown options we implemented last year, our draw.io branded app for Confluence Cloud and Jira Cloud was the first secure diagramming app to meet Atlassian's rigorous Cloud Fortified standard, making it your most secure choice for diagramming and visualization.

The draw.io App for Github is an alternative authorisation method you can use to limit draw.io's repository access to specific repositories, rather than all of the repositories in your account.

We researched a stricter implementation of our content security policy on the test se.diagrams.net domain. Take up of the domain has been very low, so we will port all the changes we can from that project and then close it down.

New and updated integrations

Several new integrations were released, and existing ones were updated in the past year. New and updated features common across all integrations are described in the following section.

draw.io for Atlassian Confluence and Jira

With the draw.io apps for Confluence Cloud and Jira Cloud, you can embed diagrams that are stored in Confluence Cloud in your Jira Cloud issues. Keep all of your visual documentation for systems, processes and software in your Confluence Cloud knowledge base, and reference them in your project tasks in Jira.

The draw.io app is now free in small Confluence Cloud instances (up to 10 users). If you are taking advantage of Atlassian's offer of a free Confluence Cloud instance for your small team, you can now add the draw.io board macro and embed diagrams in Confluence pages without needing to purchase a license.

We've improved the draw.io app's performance within Atlassian host products, updated the authentication to use the new API, and refreshed the Kennedy editor theme. The Gliffy and Lucidchart conversion features received a number of updates and bugfixes throughout the year.

The new draw.io board macro in Atlassian Confluence uses the updated Sketch editor theme by default, providing teams with an easy-to-use digital whiteboard.
Double click on the drawing canvas to add a shape, or click on a direction arrow, or drag a new connection to a shape in another position in the draw.io editor

draw.io for Google Workspace, Drive and Classroom

Google Classroom continued to be used extensively by schools and training providers. The draw.io app for Google Drive lets you integrate diagrams into Google Classroom assessment tasks and discussions. Diagrams set in assessment tasks can be collaboratively edited, or act like a template with each student getting their own copy.
Select whether students can view or edit the diagram file, or if they automatically get their own copy in their Google Drives on diagrams attached to assignments in Google Classroom
Tip: Install the Google Workspace apps for Docs, Sheets and Slides to embed diagrams in your Workspace documents.

draw.io for VSCode and GitHub

In combination with the third-party draw.io app for VSCode, and the github.dev web-based code editor, you can now edit diagrams stored in GitHub, without needing to change to another tab. You can even compare changes side-by-side on commit.
Compare and commit the changes you made to the diagram files in your repository via github.dev

draw.io diagrams in Notion

You can use the draw.io for Notion extension for the Chrome, Opera and Edge web browsers to store your diagram files in your Notion pages. The diagram editor loads inline in your Notion page using the simple Sketch editor theme.
Import an existing diagram into Notion via the menu, or drag and drop the file into the drawing canvas

draw.io for Microsoft Teams

You can now collaborate in real time on diagrams stored in Microsoft One Drive or Sharepoint, directly from your team’s channel with the draw.io app for Microsoft Teams. Install the draw.io app in your Teams channel to add diagrams to conversations or to a Teams tab.
draw.io in Teams: A diagram added to chat will display the first diagram page as a thumbnail

Diagram import and file conversion

The free draw.io Importer extension for the Google Chrome browser lets you convert all of your Lucidchart diagrams to draw.io in a couple of steps. This lets you continue editing all of your diagrams now that Lucidchart has limited Lucidchart EDU, their previously free education plan, to only three editable diagrams.

New features and updates in 2021

The Sketch editor theme, and the right-click context menu received a comprehensive overhaul. The tools and menus were simplified and reorganised to make it feel much more like a whiteboard you can sketch freely on. You can expand or collapse most of the panels, and move them to another location around the drawing canvas.

The freehand drawing tool was updated along with the whiteboard like editor theme.
Use the freehand drawing tool in a draw.io Board diagram to markup diagrams or draw shapes with your mouse

You can now search for templates and click on the magnifying glass in the top right of any template to see a larger preview. The draw.io template library was also expanded with more templates and template categories.
Hover over a template in draw.io to see a larger preview of it

In addition to moving diagram elements to the front or the back of an overlapping stack, you can step shapes and connectors forwards and backwards in the z-order stack using the Bring Forward and Send Backward buttons on the Arrange tab in the format panel.
Bring overlapping shapes to the front or send them to the back via the Arrange tab

You can now use a diagram page as a background behind another diagram page. It will be printed along with the diagram, and is ideal for watermarking your diagrams, providing a common layout for mockups, or adding a template for diagram metadata on development documentation.
Diagram complete with background

A waypoint shape is now available in the Misc shape library (part of the General collection). You can use the small waypoint shape to join connectors together, replacing overlapping connectors with the same target or source shape neatly and cleanly.
Drag the waypoint shape from the Misc shape library in draw.io Use waypoint shapes in draw.io to show contact points and enable line jumps to see where wires pass each other without connecting

Tags have been brought into the draw.io editor as a core feature and the experimental tags plugin has been retired. Add one or more tags to shapes and connectors to group them without needing to place them on the same layer in your diagram.

Use the Tags dialog (View > Tags) to group, select, hide or display the tagged shapes.
Tags on shapes and connectors in diagrams allow you to quickly select, hide or display related shapes without them needing to be grouped or on a single layer

Several shape libraries saw new or updated stencils, including AWS, C4, GCP, BPMN 2.0, electrical and swimlane shapes.

Many more features have been updated, expanded, and some simplified. Additional interface translations have been completed, and existing translations refreshed - thank you to all of our translators!

And of course, a mountain of bugs have been squashed.

See the changelog in our drawio GitHub repository for full details of all of the releases.

Diagramming in a free Confluence Cloud instance

· 7 min read
draw.io
draw.io Team

draw.io and the draw.io branded Atlassian integrations are the leading solution for web based sketching and diagramming functionality. The article describes the draw.io integration for Confluence that we, draw.io Ltd., build, deliver and maintain alongside the online version of our editor at app.diagrams.net, our draw.io desktop application.

Confluence Cloud is a popular tool for team productivity suitable for both small and large organisations. Atlassian provides customers with free instances, as long as the instance has ten users or fewer, and you can diagram in these instances with our draw.io Confluence Cloud integration.

Diagram freely

With the draw.io app installed in your free Confluence Cloud instance, you and your small team can draw a wide range of diagrams:

The draw.io diagram editor is easy to use and powerful. The draw.io app in Confluence Cloud is also secure and private - Your data stays in the browser while you are editing a diagram and is stored only in your Confluence Cloud instance when you use the draw.io app.

  • Attach unlimited diagrams to pages with the draw.io macros.
  • Use and connect shapes from an extensive collection of shape libraries.
  • Style shapes, connectors and text labels.
  • Draw freehand shapes and create custom shapes.
  • Use a template from the template library to start diagramming quickly.
  • Switch to various editor styles, including a simpler draw.io Board macro, ideal for brainstorming.
    Use the freehand drawing tool in a draw.io Board diagram to markup diagrams or draw shapes with your mouse

Install draw.io in a free Confluence Cloud instance

  1. Set up a new Confluence Cloud instance, choosing the Free tier of up to 10 users on Atlassian's Confluence Cloud pricing page.
  2. Step through the installation and setup until you see the space landing page and Confluence Quickstart tutorial.
    Confluence Cloud will step you through the setup of a new instance and space

Install the draw.io app for Confluence Cloud

  1. Click on the gear icon in the top right, next to your user initials to open the Confluence Cloud administration settings.
  2. Under the Atlassian Marketplace section, click on Find new apps. Search for draw.io and click on it to see details about the draw.io app for Confluence Cloud.
    Alternatively, go to the draw.io app on the Atlassian Marketplace website.
    Install the draw.io app in your Confluence Cloud instance
  3. Install the draw.io app in your Confluence Cloud instance. Note: If you have a team of users larger than 10, start a free trial - when the license expires, you'll still be able to create all types of diagrams, but some advanced features are limited to the licensed version in larger Confluence Cloud instances.

draw.io as an online whiteboard

  1. Edit a Confluence page, type /draw.io and insert the draw.io Board macro. The simple whiteboard-like editor will open.
  2. Save your diagram and page so that your remote team members can collaborate on the draw.io Board drawing with you.

Learn more about using draw.io as an online whiteboard in Confluence
With the draw.io Board macro, you have a fully featured online whiteboard inside Confluence Cloud

Learn the draw.io diagram editor

  1. Edit a Confluence page, then type /draw.io and insert the draw.io Diagram macro. This will open the draw.io editor.
    Add the draw.io Diagram macro to insert a diagram into Confluence Cloud
  2. Select the Blank Diagram template, enter a filename for your diagram, and click Create.
    Choose a diagram template when you create a new diagram in draw.io
  3. Get to know the layout of the diagram editor: the shape and format panels, the toolbar, menus and drawing canvas. The default layout is the same as at app.diagrams.net.
    The draw.io editor, its tools and panels
  4. Step through the tutorial to draw a basic flowchart in the draw.io editor.
    • add and connect shapes using the shape libraries on the left
    • add labels to the shapes and connectors on the drawing canvas
    • style your diagram using the tools in the format panel on the right.
      Create your diagram from shapes, connectors and text, and add styles
  5. Instead of exporting your diagram, click Publish to save your new diagram, or Save & Exit to save an existing diagram, then publish your Confluence page.

License draw.io for larger teams

The price of the draw.io app is very affordable in Confluence Cloud. See the tier-price comparison when migrating from Confluence Server to Confluence Cloud with draw.io.

If you have started a free trial in your team of more than 10 users and let the license expire, you will need to purchase draw.io to continue diagramming in your instance.

Licensing the draw.io app for your larger Confluence Cloud instance allows you to receive product support and use all of draw.io's features, including those listed below.

  • Import and export .vsdx files.
  • Drag and drop diagram files into the editor.
  • Add multiple pages to a diagram.
  • Export to PDF files and print diagrams.
  • Use math typesetting.
  • Set up and use custom shape libraries.
  • Customise the draw.io editor and set global corporate styles with JSON configuration options.
  • Use the search feature to find shapes.
  • Use the collaborative editing functionality to simultaneously edit a diagram with your teammates.
  • Work with the diagram file's revision history.
  • Display an older version of the diagram when viewing a page.
  • Import Mermaid code to automatically create a diagram.
  • Import CSV data with formatting options to automatically create a diagram.
  • Embed diagrams from cloud storage platforms (Google Drive and Microsoft OneDrive).
    Embedded diagrams in draw.io for Confluence Cloud

Small teams with up to 10 Confluence Cloud users can use all of the features of the draw.io app for free.

New draw.io Board macro for whiteboard-style diagrams in Confluence Cloud

· 7 min read
draw.io
draw.io Team

Embed whiteboard-style diagrams in Confluence Cloud pages with the new draw.io Board macro. The Board macro is a new feature for our integration with Confluence Cloud, delivered as part of our draw.io brand.

When you add or edit a diagram using the draw.io Board macro, it uses the Sketch editor theme, with the rough sketch shape and connector styles set as the default global style. The diagram editor has a a white non-paginated background and no grid lines so it feels more like a whiteboard.

A discussion thread on the GitHub draw.io project is open if you have any questions or suggestions.

Add the draw.io Board macro to a Confluence Cloud page

  1. Edit the page and type /draw to see a list of macros you can embed.
  2. Select the draw.io Board macro from the list to open the diagram editor.
    Add the draw.io Board macro to a Confluence Cloud page

Diagram in Confluence Cloud using the draw.io Board macro

The draw.io Board macro uses a simplified editor theme, where the diagramming tools are reduced to the essentials. The panels you are used to seeing in draw.io are minimised to make it feel more like a whiteboard.

You can display panels and use the menus at any time to use the full functionality of the draw.io editor in the draw.io Board macro.

Zoom: To zoom in and out, click on the magnifying glass tools in the bottom right. Click on the number in the center to reset the zoom to 100%.

Dark mode: To switch between the default light theme and a dark theme (dark background and interface), click on the moon/sun tool in the bottom right.
Zoom in and out and switch the editor into a dark mode with the tools in the bottom right in a draw.io Board diagram

Open the menu in the draw.io Board macro

Click on the draw.io logo in the top left to open the menu.
Click on the draw.io logo to open the menu when using the draw.io Board macro

Undo and redo: Click on the undo and redo arrows next to the menu icon to undo and redo the most recent changes. These will not be shown unless you have edited the diagram.

Work with shapes in the draw.io Board macro

Add shapes: Double click on a blank space on the drawing canvas and select a shape.
Double click on the drawing canvas to add a shape, or click on a direction arrow, or drag a new connection to a shape in another position in the draw.io editor

Connect shapes: Hover over shapes to see direction arrows.

  • Click on the direction arrow to add a new shape in that direction.
  • Click and drag a new connector from the source shape and drop it on another shape to connect them.

Alternatively, click on or drag the text, sticky notes, basic shapes and connectors in the top half of the toolbar on the left to add them to the drawing canvas.
Click on the shapes or drag them from the toolbar onto the drawing canvas

Use shape libraries in the draw.io Board macro

To see the shape libraries and use a greater variety of shapes, click on Shapes in the toolbar to open the Shapes panel.

  • Search for shapes by entering a search term and press enter.
  • Drag shapes or groups of shapes from the drawing canvas to the scratchpad.
  • Enable more shape libraries: Click on More Shapes toward the bottom of the shape library, select the shape library, then click Apply.
    Click on the Shapes tool to open the Shapes panel and access all the shapes in the shape library

Draw a freehand shape in the draw.io Board macro

You can draw images with a transparent background with your mouse.

  1. Click on the Freehand tool in the toolbar.
    Click on the shapes or drag them from the toolbar onto the drawing canvas
  2. Click Start Drawing in the Freehand panel.
  3. Click and hold to draw a freehand line on the drawing canvas. You can add multiple separate lines in your freehand drawing.
  4. Click Stop Drawing when you are finished, to save it as an image with a transparent background.
    Use the freehand drawing tool in a draw.io Board diagram to markup diagrams or draw shapes with your mouse

Learn more about drawing and styling freehand shapes

Tip: Use the Style tools in the format panel on the right to change your freehand shape's style, just as you would a shape from the shape libraries.

Style shapes in the draw.io Board macro

To access the format panel, click on the minimised heading. The tools and options that are available in the format panel will depend on what you have selected in your diagram.
Click on the Format panel's title to open it and style shapes, text and connectors in a draw.io Board diagram

Insert a template in the draw.io Board macro

Click on the Template tool to select and use a diagram template from the template library. Click on the magnifying glass in the top right of a template to see a larger preview of it.
Select a diagram template and click Insert to add it to the drawing canvas in a draw.io Board diagram in Confluence Cloud

Save the draw.io Board to Confluence Cloud

  1. Click Publish in the top right to save your diagram.
  2. Enter a filename if it is a new diagram, and click Save.
    Publish your diagram to save it and return to the Confluence Cloud page editor

You will return to the Confluence page and see a preview of your diagram in the draw.io Board macro.

Finally, publish your Confluence page.

Change the draw.io Board macro viewer settings

There are two methods to change how your diagram appears to viewers:

When viewing the Confluence page, hover over the diagram, click on the gear icon in the toolbar, change the viewer settings then click Save.
Set the viewer options to change how your diagram appears on the Confluence page
Note: If the diagram uses the Simple Viewer, you will not see the toolbar

Alternatively, from within the draw.io diagram editor, make sure nothing in your diagram is selected, then open the Format panel. The Viewer options are available at the top of the Diagram tab of the format panel.
Set the viewer options within the draw.io Board editor to change how your diagram appears on the Confluence page

UML 2.5 shape library with updated shapes

· 5 min read
draw.io
draw.io Team

The Unified Modeling Language (UML) is a set of standard symbols and diagram types, commonly used in data modelling, workflow visualisation, and system modelling. UML notation is the defacto industry standard in the fields of software development, IT infrastructure, business systems and other fields. Many languages, such as SysML, SoaML, and a number of architecture frameworks use and extend UML.
Activity diagrams are used to model workflows in various ways

The UML 2.5 specification updated the notation, or the shapes used in diagrams so they could represent a wider range of concepts more clearly. The specification document was extensively rewritten to make it easier to understand.

No new diagram types were added in UML 2.5 - the 14 diagram types that were previously defined in UML 2.0 are extended to cover the additional concepts, with many examples provided in the specification document.

UML diagram types

UML diagrams are divided into two categories that provide you with static (structural) and dynamic (behavioural) views of a system.

Diagram types defined in UML 2.5
Open this in our free diagram viewer

Enable the UML 2.5 shape library

  1. Click on More Shapes at the bottom of the left panel in draw.io, scroll down and click on the checkbox next to the UML 2.5 shape library in the Software section. You may want to also enable the UML shape library. Then click Apply.
    Enable the UML 2.5 shape library, and the older UML library if you wish to use those shapes
  2. The UML 2.5 shape library will appear in the left panel.
    The shapes in the UML 2.5 shape library let you create clearer and more extensive UML diagrams of many types

Using these shapes, and some of the shapes from the General and older UML shape libraries, you can create the full range of UML diagrams.

Example UML diagrams

Click on a diagram below to open in our diagram viewer

Component diagrams show the dependencies between the logical and physical components of a system with the interfaces that each component requires and provides and their ports.

Component diagrams show the dependencies between the components of a system.

Composite structure diagrams are used to show the internal structure of a classifier, with its properties, parts and relationships, or how a collaboration behaves. You can break down the behaviour of a collaboration into one or more specific situations (occurrences) in a collaboration or collaboration use diagram.

Composite structure diagrams are used to show the internal structure of a classifier

Deployment diagrams shows the system infrastructure and how various software executables and artifacts are deployed on deployment targets.

Deployment diagrams shows the system infrastructure and how various software executables and artifacts are deployed on deployment targets.

Activity diagrams are used to model workflows in various ways. In this example, the workflow actions are arranged into swimlanes representing the actors, with a section that allows an interrupt (exception) to cancel the order.

Activity diagrams are used to model workflows in various ways

Go to diagram.new to create a new diagram

· 2 min read
draw.io
draw.io Team

You can now create a new diagram even faster by going to diagram.new or diagrams.new instead of having to remember the full app.diagrams.net address for the online version of draw.io.

.new is the first and only domain that is devoted to helping you get things done fast. Each and every address that ends with .new is an action that lets you create or share content online.

The .new domain helps you create content quickly

Google has set up the .new domain exclusively to help you create and work with content quickly and easily. Several different types of content and actions are available already:

For example:

Instead of remembering the full URL of the websites and services, just enter the type of content you want to create or action you want to do and add .new to the end.

Only trusted apps

As there is a rigorous application process with a well-defined registration and security policy, Google only grants trusted and reliable applications or shortcuts a .new address.

Try it out

Go to diagram.new and create a new diagram.

If you have any questions, please post them to https://groups.google.com/forum/#!forum/drawio. If it's technical, you can open an issue at GitHub.